Average humidity in La Herradura
On this page you find more information about the monthly relative humidity over the year in La Herradura (), El Salvador.
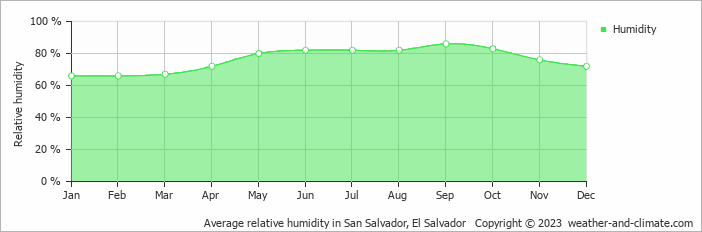
La Herradura's humidity levels vary throughout the year. The highest levels occur in September, reaching 86% (very high), while the lowest is recorded in January at 66%.
Throughout the year, the average humidity in La Herradura is 76%.
Humidity plays an important role in how temperatures are felt. During the warmest month, April, the maximum average temperature is around 32°C (90°F). Combined with high humidity during this period, the temperature can feel even warmer than the thermometer shows.
During the coldest month, October, the maximum average temperature is around 30°C (86°F). This period has very high humidity. Check out our detailed temperature page for more information.
La Herradura Weather by Month
Pick a month to see the average temperature, rainfall and sunshine in La Herradura - and find the best time to visit.


La Herradura 3-Day Forecast
Temperature Rainfall Sunshine Humidity
See the full La Herradura climate overview or explore weather in El Salvador.
Popular this month
Where to go in September - average daytime high across popular destinations.
 San Miguel
 32°C (90°F) San Salvador31°C (88°F) El Cuco31°C (88°F) Santa Ana31°C (88°F) El Zonte29°C (84°F) Concepción de Ataco29°C (84°F) La Libertad29°C (84°F) El Sunzal29°C (84°F)














Bucket list
Need travel inspiration? Check out our bucket list articles and be inspired.