La Herradura Precipitation: Average Monthly Rainfall and Snowfall
This graph shows the average amount of rainfall per month in La Herradura (). The numbers are calculated over a 30-year period to provide a reliable average.
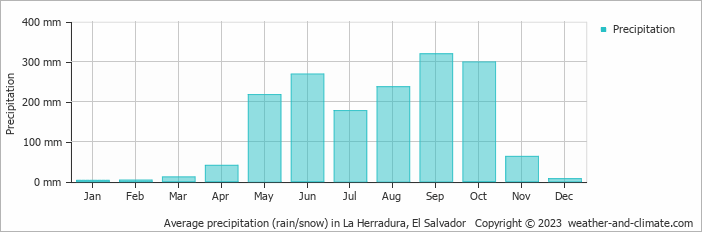
- A lot of rain (rainy season) falls in the months: May, June, July, August, September and October.
- La Herradura has dry periods in January, February, March and December.
- On average, September is the wettest month with 319 mm of precipitation.
- On average, January is the driest month with 3 mm of precipitation.
- The average amount of annual precipitation is 1642 mm.
Current rainfall in La Herradura
Tue Dec 03
35°C | 25°C
N  14 km/h
14 km/hbroken clouds and no rain
Wed Dec 04
34°C | 24°C
N 14 km/h
14 km/hbroken clouds and no rain
Thu Dec 05
34°C | 24°C
S 14 km/h
14 km/hpartly cloudy and no rain


