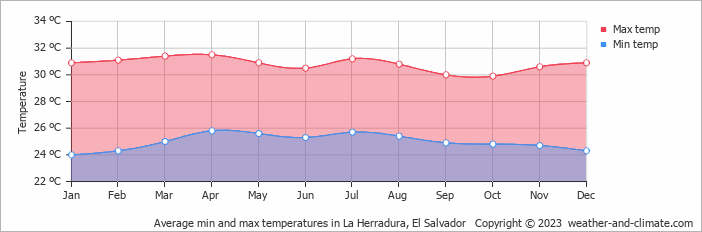
La Herradura Temperature by Month
This graph shows the average minimum and maximum temperatures throughout the year in La Herradura (), El Salvador. The minimum temperature is often recorded between 4 AM and 6 AM, while the highest temperature is usually reached at 3 PM. During this time the sun's heating effect is the strongest.
Temperature patterns do vary with the seasons. In winter, the time of minimum and maximum temperatures can shift slightly compared to summer.
- The months of September and October have nice average temperatures.
- On average, the temperatures are always high.
- On average, the warmest month is April with 32°C.
- On average, the coolest month is October with 30°C.
- The average annual maximum temperature is 31°C.
- The average annual minimum temperature is 25°C.
Current temperature in La Herradura
Tue Dec 03
35°C | 25°C
N  14 km/h
14 km/hbroken clouds and no rain
Wed Dec 04
34°C | 24°C
N 14 km/h
14 km/hbroken clouds and no rain
Thu Dec 05
34°C | 24°C
S 14 km/h
14 km/hpartly cloudy and no rain


