









 Stay in a Mongolian Ger
Discover the magic of Mongolia, from the Gobi Desert to Khövsgöl Lake, and experience traditional nomadic life in a Ger under starlit skies.
August in Baruun Urt sees daytime temperatures around 26°C (79°F) and lows of 13°C (55°F) at night. The excellent weather makes it a good time to visit.
If you're a fan of comfortable temperatures and drier conditions, August is a great time to visit.
 Min Temperature
Max Temperature
 Chance of Rain
Precipitation
Rainy days
 Windspeed
 Sunshine
Percentage Sunshine
Pick a month to see the average temperature, rainfall and sunshine in Baruun Urt - and find the best time to visit.
50-year average (1976-2025)
Based on our historical records, temperatures in Baruun Urt typically drop from around 27°C (81°F) at the start of August to approximately 22°C (72°F) by the end. Nights are cool, with lows typically ranging from 11°C (52°F) to 16°C (61°F).
50-year average (1976-2025)
Average daily rainfall for each day of the month based on long-term records.
Browse day-by-day weather records for Baruun Urt spanning 51 years. Select any month and year to see actual temperatures, rainfall, and conditions recorded on each day.
Our historical data for Baruun Urt spans 1997 to 2026, revealing these weather extremes.
Find out more about the weather in Mongolia and which places have the best travel conditions in this month. See all of Mongolia in August →
Perfect weather is subjective. On this map perfect weather has been defined with temperatures between 20°C (68°F) and 29°C (84°F) and not too much precipitation (less than 90 mm (3.5 in) a month).
Warm but pleasant conditions in Baruun Urt in August. Focus on lightweight, maybe with natural fabrics, cotton blend shirts, comfortable shorts, and breathable footwear. A light cover-up for sun protection is smart too. Wet weather is likely, so pack waterproof gear for multiple rainy days. And with plenty of sunshine hours, don’t forget sunglasses, sunscreen, and maybe a sun hat.
We rated the following activities from 1 (least suitable) to 10 (best) to do.


Temperature Rainfall Sunshine Wind Speed
See the full Baruun Urt climate overview or explore weather in Mongolia.
Where to go in August - average daytime high across popular destinations.
Zamiin Ude 29°C (84°F) Saikhan-ovoo28°C (82°F) Dalanzadgad26°C (79°F) Baruun Urt
 26°C (79°F) Gobi desert26°C (79°F) Baitag25°C (77°F) Ulan Gom22°C (72°F) Ulaanbaatar
 22°C (72°F)
Need travel inspiration? Check out our bucket list articles and be inspired.
Stay in a Mongolian Ger
Discover the magic of Mongolia, from the Gobi Desert to Khövsgöl Lake, and experience traditional nomadic life in a Ger under starlit skies.
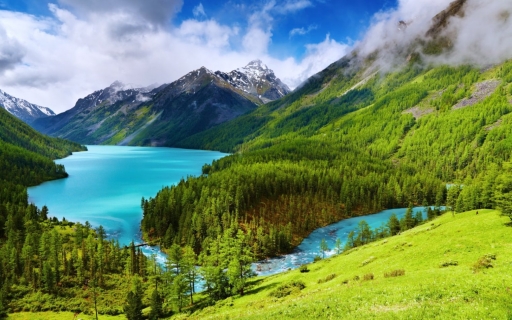
 Be amazed by the Altai mountains
The Atlai mountains are a sparsely populated area that most tourists have not yet discovered. Definitely bucket list material for the adventurous travelers among us.
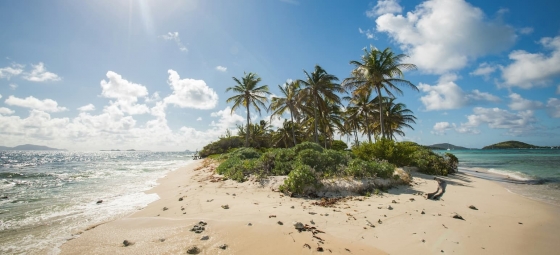
 10 Hidden gems in Asia you need to visit
Explore 10 hidden gems in Asia offering authentic experiences, from pristine beaches and remote islands to cultural treks and peaceful mountain villages.
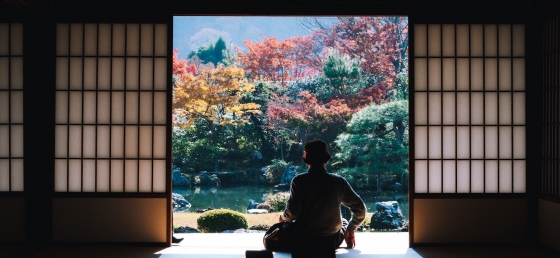
 Chase the autumn leaves in Japan
Japan is one of these cases which turns into a gold, yellow and orange fairy tale starting from September. And we can honestly say: We cannot imagine a more beautiful season to visit Japan.