









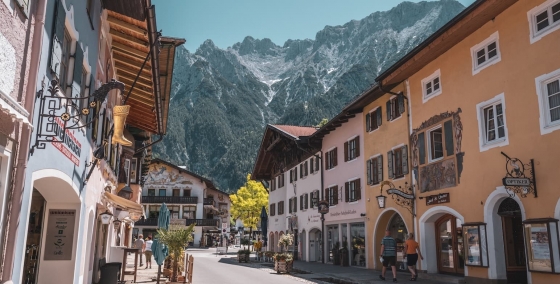
 The 10 most beautiful towns in Germany
Explore Germany's hidden gems with our guide to 10 stunning cities beyond Berlin. Discover historic towns, unique culture, and cozy atmospheres."
August in Winterberg averages 22°C (72°F) during the day and 12°C (54°F) at night. Quite a bit of rainfall is typical this month, with around 101 mm (4 in) on average. An umbrella is a good idea.
For Winterberg itself, June generally stands out with the best circumstances. If you're seeking pleasant, dry and sunny weather somewhere else in the world, our weather planner can help you explore other options.
 Min Temperature
Max Temperature
 Chance of Rain
Precipitation
Rainy days
 Humidity
 Sunshine
Percentage Sunshine
Pick a month to see the average temperature, rainfall and sunshine in Winterberg - and find the best time to visit.
50-year average (1976-2025)
Based on our historical records, temperatures in Winterberg typically stay consistent throughout August, with daily highs averaging around 22°C (72°F). Nights are cool, with lows typically ranging from 10°C (50°F) to 13°C (55°F).
Browse day-by-day weather records for Winterberg spanning 51 years. Select any month and year to see actual temperatures, rainfall, and conditions recorded on each day.
The extremes listed below come from historical weather data collected in Winterberg from 1976 through 2026.
Find out more about the weather in Germany and which places have the best travel conditions in this month. See all of Germany in August →
Perfect weather is subjective. On this map perfect weather has been defined with temperatures between 20°C (68°F) and 29°C (84°F) and not too much precipitation (less than 90 mm (3.5 in) a month).
Pleasant temperatures in August mean you can pack light but flexibel pieces. Think cotton t-shirts, comfortable walking shorts, and one warmer layer for evenings. A light sweater or denim jacket works well. Prepare for significant rainfall with proper waterproof clothing and shoes. It won't hurt to bring your sunglasses along, as you'll see some sunny periods.
We rated the following activities from 1 (least suitable) to 10 (best) to do.


Temperature Rainfall Sunshine Humidity
See the full Winterberg climate overview or explore weather in Germany.
Where to go in August - average daytime high across popular destinations.
Berlin 26°C (79°F) Düsseldorf24°C (75°F) Hanover24°C (75°F) Munich25°C (77°F) Cologne25°C (77°F) Hamburg24°C (75°F) Winterberg
 22°C (72°F) Binz
 21°C (70°F)
Need travel inspiration? Check out our bucket list articles and be inspired.
The 10 most beautiful towns in Germany
Explore Germany's hidden gems with our guide to 10 stunning cities beyond Berlin. Discover historic towns, unique culture, and cozy atmospheres."
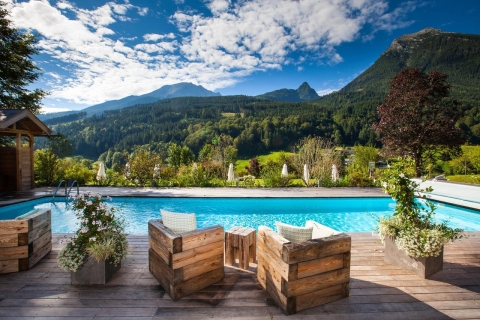 The dreamlike scenery of the German Alps
Nature in the most south-eastern part of Germany is impressive. The German Alps, with their diversity of landscapes, are an ideal destination for a wonderful holiday in nature.
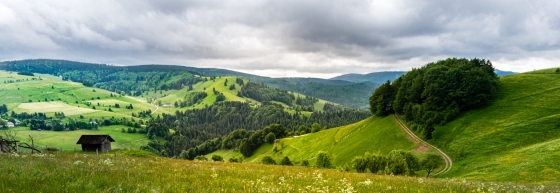 Discover Germany's Black Forest
Immerse yourself in nature and enjoy sustainable tourism practices in Germany's Black Forest. Hike, do yoga, and savor local organic cuisine and beer.
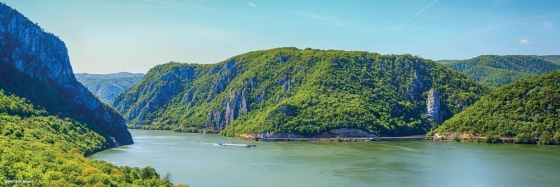
 Cycle the Danube trail
The Danube cycle route is one of the most popular cycling routes in Europe, and rightly so, because it is a varied route that is interesting both in terms of culture and nature.