
















 The 10 most alternative cities in South America
Discover South America's top 10 alternative cities! From Valparaíso's vibrant streets to La Paz's high-altitude charm and Medellín's innovative spirit.
May in Rengo brings moderate temperatures, with highs of 17°C (63°F) and nights dropping to 5°C (41°F). Rainfall is on the higher side this month, averaging around 114 mm (4.5 in), so keep a rain jacket handy.
If your ideal day consists of dry skies and pleasant temperatures, January, February, March, April, October, November and December typically offer the best circumstances for Rengo.
 Min Temperature
Max Temperature
Min Temperature
Max Temperature
 Chance of Rain
Precipitation
Rainy days
Chance of Rain
Precipitation
Rainy days
 Humidity
 Sunshine
Percentage Sunshine
Sunshine
Percentage Sunshine
Pick a month to see the average temperature, rainfall and sunshine in Rengo - and find the best time to visit.
50-year average (1976-2025)
Based on our historical records, temperatures in Rengo typically drop from around 17°C (63°F) at the start of May to approximately 14°C (57°F) by the end. Nights are cold, with lows typically ranging from 4°C (39°F) to 7°C (45°F).
50-year average (1976-2025)
Average daily rainfall for each day of the month based on long-term records.
Browse day-by-day weather records for Rengo spanning 51 years. Select any month and year to see actual temperatures, rainfall, and conditions recorded on each day.
Based on weather observations in Rengo between 1976 and 2026, these are the recorded extremes during May.
Find out more about the weather in Chile and which places have the best travel conditions in this month. See all of Chile in May →
Perfect weather is subjective. On this map perfect weather has been defined with temperatures between 20°C (68°F) and 29°C (84°F) and not too much precipitation (less than 90 mm (3.5 in) a month).
For Rengo in May, you'll want flexible clothing. It's wise to pack cotton shirts, comfortable shorts, and a pair of jeans for cooler evenings. A light sweater or jacket is useful for air-conditioned spaces (like buses) or unexpected cool moments. High rain levels are expected, so pack waterproof gear and an umbrella or poncho. Sunglasses aren't essential this month, though you might want them for the occasional bright moment.
We rated the following activities from 1 (least suitable) to 10 (best) to do.


Temperature Rainfall Sunshine Humidity
See the full Rengo climate overview or explore weather in Chile.
Where to go in May - average daytime high across popular destinations.
 Hanga Roa
 23°C (73°F) La Serena19°C (66°F) San Pedro de Atacama
 19°C (66°F) Santiago18°C (64°F) Concón17°C (63°F) Valparaíso16°C (61°F) Viña del Mar17°C (63°F) Pucón
 13°C (55°F)
 Need travel inspiration? Check out our bucket list articles and be inspired.
The 10 most alternative cities in South America
Discover South America's top 10 alternative cities! From Valparaíso's vibrant streets to La Paz's high-altitude charm and Medellín's innovative spirit.
 Torres del Paine
Torres del Paine is an huge national park on the border with Argentina. It is possible to walk here along craters, high-rising mountain ridges, over glaciers and through vast majestic tundra.
 Explore Patagonia
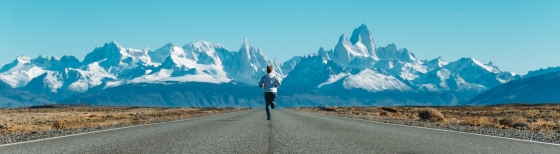
A tour through Patagonia brings you to the end of the world. That’s why Patagonia is a bucket list destination for many. We recommend to visit Patagonia from November to early March.
 Enjoy the silence and peace in a spectacular landscape
This lodge guarantees privacy and exclusivity for those seeking to get away from mass tourism and enjoy the silence and peace in a spectacular landscape.