



















 7 of the most budget-friendly destinations in Europe
Discover Europe's top budget-friendly destinations including Budapest, Kotor, Krakow, and more, perfect for affordable and exciting travel.
On this page you find the mean water temperature over the year in Figueira (the Algarve), Portugal. Take a closer look at the water temperature patterns and what they mean for swimming and recreation.
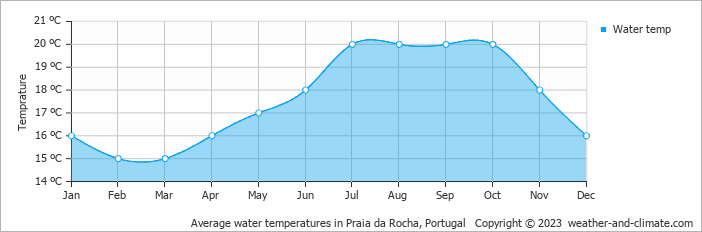
Figueira experiences water temperature shifts throughout the year. The warmest month, July, reaches an average of 20°C (68°F).
The coldest month, February, averages 15°C (59°F). Visitors during these months can leave their swimming gear at home.
Pick a month to see the average temperature, rainfall and sunshine in Figueira - and find the best time to visit.
Temperature Rainfall Sunshine Humidity Wind Speed Water Temp
See the full Figueira climate overview or explore weather in Portugal.
Where to go in October - average daytime high across popular destinations.
Need travel inspiration? Check out our bucket list articles and be inspired.
7 of the most budget-friendly destinations in Europe
Discover Europe's top budget-friendly destinations including Budapest, Kotor, Krakow, and more, perfect for affordable and exciting travel.
 Warm Sea Without Extreme Heat: 8 Beach Destinations With Comfortable Weather
Love warm seawater but not extreme heat? Compare eight beach destinations where the sea stays warm while daytime temperatures remain comfortable.
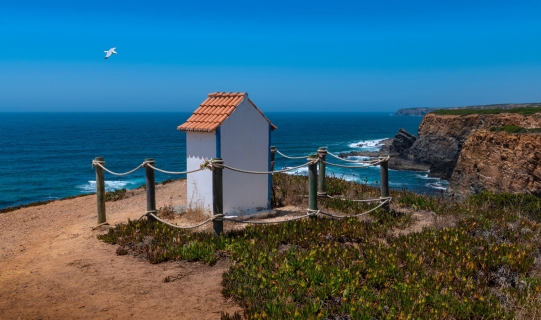
 Alentejo, where time stands still
The quiet region is known for its rolling green hills and it is a true hiking paradise. Architectural highlights can be found in the castles, ancient monasteries or when exploring the countless charming villages.
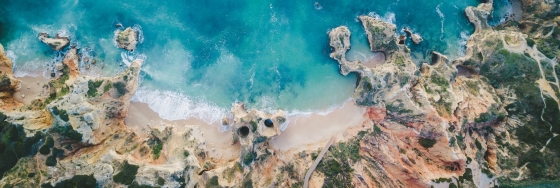 An eco-friendly guide to Lagos travel
Lagos, Portugal is a great place to visit while being careful about your environmental footprint. Here you find some tips about environmentally places to stay, where to eat and how to get around in the area.