Havana Rainfall & Precipitation: Monthly Averages and Year-Round Insights
This page shows the average amount of rainfall per month in Havana. The numbers are calculated over a 30-year period to provide a reliable average. Now, let’s explore all the details to give you a full picture.
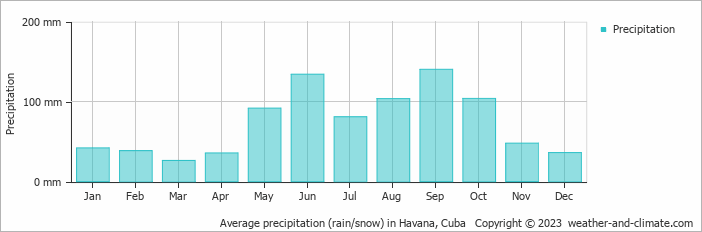
On average, Havana receives a reasonable amount of rainfall, with an annual precipitation of 878 mm.
Monthly Precipitation Levels
The average number of days each month with precipitation (> 0.2 mm)
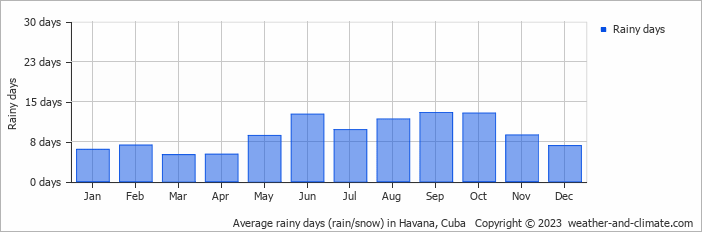
Havana can be quite wet during September, receiving approximately 140 mm of precipitation over 13 rainy days.
In contrast March, experiences much drier conditions, with 26 mm of rainfall, spread across 5 rainy days.September, the wettest month, has a maximum daytime temperature of 32°C. The city receives 228 hours of sunshine in this period. During the driest month March you can expect a temperature of 28°C. For more detailed insights into the city’s temperatures, visit our Havana Temperature page.
Annual Precipitation in Cuba
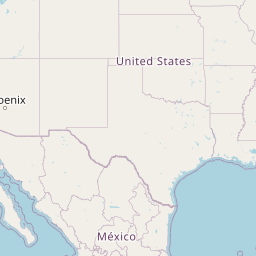
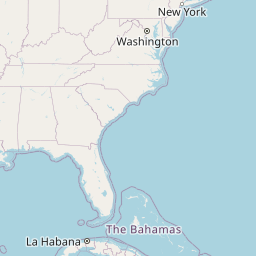
The map below shows the annual precipitation across Cuba. You can also select the different months in case you are interested in a specific month.


 heavy rainfall
 high
high
 moderate
 low
low
 almost none
Amsterdam Precipitation Compared World Wide
Havana’s average annual precipitation is 878 mm. Let’s compare this to some popular worldwide tourist destinations:
Seville, Spain, experiences 541 mm of rainfall annually, with wet winters and dry summers typical of southern Spain.
In Shanghai, China, the annual average precipitation is 1347 mm, with a humid subtropical climate.
Perth, Australia, receives 565 mm of rainfall annually, mostly during the winter months.
Bangkok, Thailand, experiences a tropical monsoon climate with 1668 mm of annual rainfall, with the heaviest precipitation occurring during September and October.
How is Precipitation Measured?
Precipitation amounts are measured using specific gauges installed at weather stations, collecting both rain and snow and any other type of precipitation. Rainfall is measured directly in millimeters, while that from snow and ice is obtained by melting it. Automated systems often incorporate heaters to make this easier.
Information from these stations is transmitted via Wi-Fi, satellite, GPS, or telephone connections to central monitoring networks. This information is immediately updated and integrated into weather models and forecasts.
Interesting weather facts
- "Ginger" was the longest-lasting Atlantic tropical storm, which spun around the open ocean for 28 days in 1971.
- The world's largest snowflake was recorded in the Guinness Book of Records, at 38 cm wide and 20 cm thick. The snowflake fell at Fort Keogh, Montana, USA, on 28 January 1887.
- The greatest snowfall recorded was on Mt. Rainier, Washington State, USA—over 31.5 meters fell during the winter of 1972.
For more detailed information about Havana’s weather, including sunshine hours, humidity levels, and temperature data, visit our Havana Climate page.
Current rainfall in Havana


