
















 An alternative way to discover Sydney
We have made an overview of the sights in Sydney that you must see if you want to visit Sydney in an alternative way.
This page shows both the average monthly rainfall and the number of rainy days in Woolgoolga, New South Wales, Australia. These averages rely on historical data collected over 30 years, from 1990 to 2020. Now, let's explore all the details to give you a full picture.
Woolgoolga has a notably wet climate with abundant precipitation, recording 1209 mm (48 in) of rainfall per year.
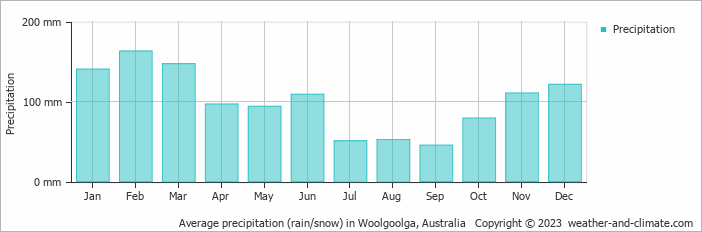
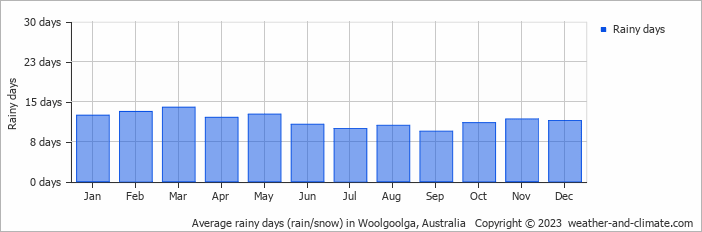
The climate in Woolgoolga shows significant variation throughout the year. Expect 163 mm (6.4 in) of precipitation during the wettest month February, distributed over 13 rainy days.
In contrast, September offers drier and sunnier days, with around 45 mm (1.8 in) of rainfall over 9 rainy days.
February, the wettest month, has a maximum daytime temperature of 27°C (81°F). The city receives 211 hours of sunshine in this period. During the driest month September you can expect a temperature of 22°C (72°F). For more detailed insights into the city's temperatures, visit our Woolgoolga Temperature page.
The map below shows the annual precipitation across Australia. You can also select the different months in case you are interested in a specific month.
Woolgoolga's average annual precipitation is 1209 mm (48 in). Let's compare this to some popular worldwide tourist destinations:
Athens, Greece, receives an average annual precipitation of 400 mm (16 in), making it one of the drier Mediterranean climates with rainfall mostly in winter.
Osaka, Japan, experiences 1507 mm (59 in) of rainfall annually, spread across the year with wetter summers.
Adelaide, Australia, enjoys 511 mm (20 in) of annual precipitation, with dry summers and wet winters.
Kuala Lumpur, Malaysia, receives 2529 mm (100 in) of annual rainfall, characteristic of its equatorial tropical rainforest climate, with consistent rainfall throughout the year and peak months during March and November.
Precipitation amounts are measured using specific gauges installed at weather stations, collecting both rain and snow and any other type of precipitation. Rainfall is measured directly in millimeters, while that from snow and ice is obtained by melting it. Automated systems often incorporate heaters to make this easier.
Information from these stations is transmitted via Wi-Fi, satellite, GPS, or telephone connections to central monitoring networks. This information is immediately updated and integrated into weather models and forecasts.
Climate change is affecting precipitation patterns worldwide, including Woolgoolga:
For more detailed information about Woolgoolga's weather, including sunshine hours, humidity levels, and temperature data, visit our Woolgoolga Climate page.
Pick a month to see the average temperature, rainfall and sunshine in Woolgoolga - and find the best time to visit.
Temperature Rainfall Sunshine Humidity Wind Speed Water Temp
See the full Woolgoolga climate overview or explore weather in Australia.
Where to go in October - average daytime high across popular destinations.
Noosa Heads 25°C (77°F) Brisbane
 26°C (79°F) Byron Bay24°C (75°F) Gold Coast
 24°C (75°F) Perth23°C (73°F) Sydney22°C (72°F) Adelaide20°C (68°F) Melbourne20°C (68°F)
 Need travel inspiration? Check out our bucket list articles and be inspired.
An alternative way to discover Sydney
We have made an overview of the sights in Sydney that you must see if you want to visit Sydney in an alternative way.
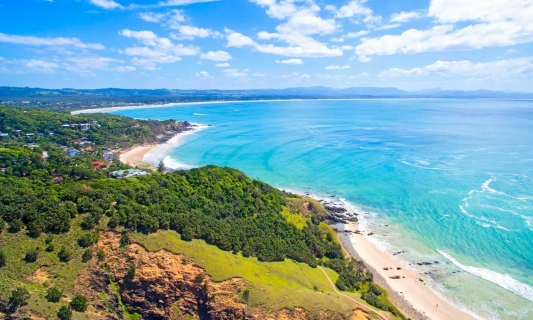 The most relaxed and alternative area of Australia is called the Byron Shire
The Byron Shire is one of the most pretty areas in the world. Not only in terms on natural beauty, also the relaxed vibe and people make this an area that remains close to your heart.
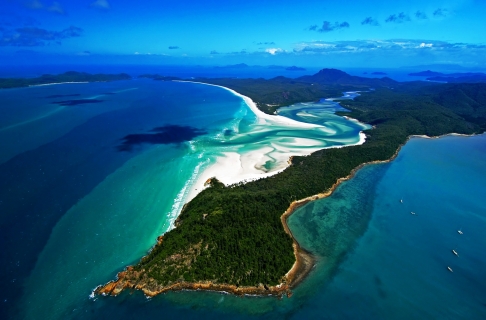 Sail the Whitsunday islands
The best travel period to sail the Whitsunday islands is “winter” between June and October, with pleasant temperatures around 23 degrees Celsius (74 Fahrenheit).
 The best dive spots in Australia
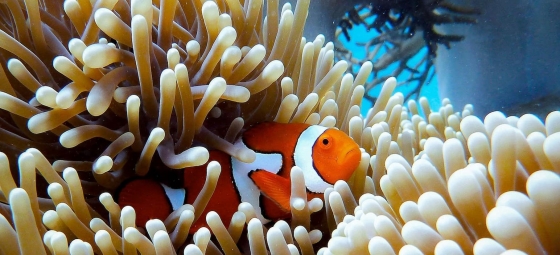
Explore Australia's best dive spots: from the Great Barrier Reef to HMAS Perth. Discover vibrant corals, marine life, and historic wrecks.