Wolfach Monthly Rainfall & Precipitation
This page shows both the average monthly rainfall and the number of rainy days in Wolfach, Baden-Württemberg, Germany. This average is based on long-term data collected between 1990 and 2020. Now, let's break down all the details for a clearer picture.
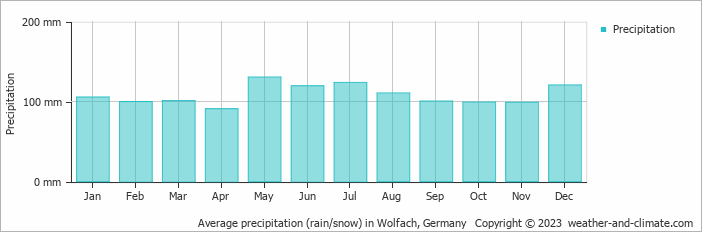
Wolfach experiences significant rain/snowfall throughout the year, averaging 1299 mm (51 in) of precipitation annually.
Monthly Precipitation Levels
The average number of days each month with precipitation (> 0.2 mm (0.01 in))
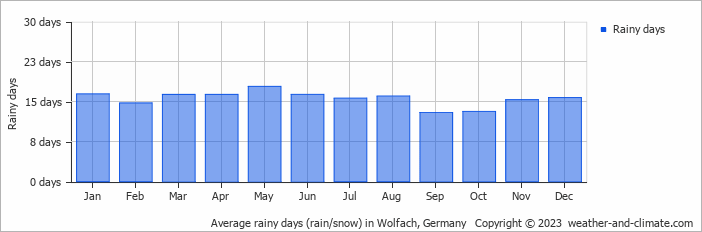
Precipitation levels in Wolfach remain relatively steady throughout the year. May has the most rain, with 130 mm (5.1 in) over 18 days. In April, this drops slightly to 91 mm (3.6 in), making the city's climate fairly predictable.
May, the wettest month, has a maximum daytime temperature of 19°C (66°F). The city receives 205 hours of sunshine in this period. During the driest month April you can expect a temperature of 15°C (59°F). For more detailed insights into the city's temperatures, visit our Wolfach Temperature page.
Annual Rainfall in Germany: City Comparison
The map below shows the annual precipitation across Germany. You can also select the different months in case you are interested in a specific month.
 heavy rainfall
 high
high
 moderate
 low
low
 almost none
Wolfach vs World: Rainfall Compared
Wolfach's average annual precipitation is 1299 mm (51 in). Let's compare this to some popular worldwide tourist destinations:
In Barcelona, Spain, the average annual precipitation is 620 mm (24 in), evenly distributed across the year with no extreme wet or dry seasons.
Beijing, China, receives 560 mm (22 in) of annual precipitation, concentrated in the summer months.
In Brisbane, Australia, the annual precipitation is 979 mm (39 in), making it wetter than Sydney.
Ho Chi Minh City, Vietnam, receives 1955 mm (77 in) of annual rainfall, with a pronounced wet season from May to November, typical of its tropical monsoon climate.
Precipitation amounts are measured using specific gauges installed at weather stations, collecting both rain and snow and any other type of precipitation. Rainfall is measured directly in millimeters, while that from snow and ice is obtained by melting it. Automated systems often incorporate heaters to make this easier.
Information from these stations is transmitted via Wi-Fi, satellite, GPS, or telephone connections to central monitoring networks. This information is immediately updated and integrated into weather models and forecasts.
- "Ginger" was the longest-lasting Atlantic tropical storm, which spun around the open ocean for 28 days in 1971.
- The world's largest snowflake was recorded in the Guinness Book of Records, at 38 cm (15 inches) wide and 20 cm (7.9 inches) thick. The snowflake fell at Fort Keogh, Montana, USA, on 28 January 1887.
- The greatest snowfall recorded was on Mt. Rainier, Washington State, USA—over 31.5 meters (103 feet) fell during the winter of 1972.
For more detailed information about Wolfach's weather, including sunshine hours, humidity levels, and temperature data, visit our Wolfach Climate page.