Rosolina Mare Monthly Rainfall & Precipitation
This page shows both the average monthly rainfall and the number of rainy days in Rosolina Mare, Veneto, Italy. This average is based on long-term data collected between 1990 and 2020. Now, let's explore all the details to give you a full picture.
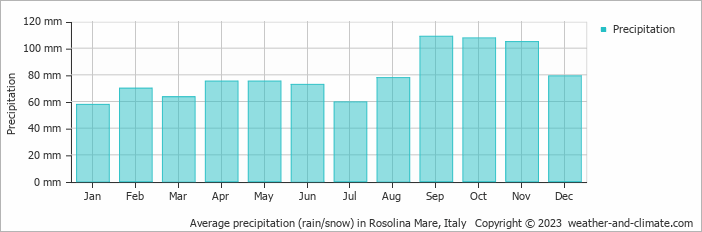
Generally, Rosolina Mare receives mid-range precipitation levels, with 952 mm (37 in) annually.
Monthly Rainfall & Rainy Days
Monthly Precipitation Levels
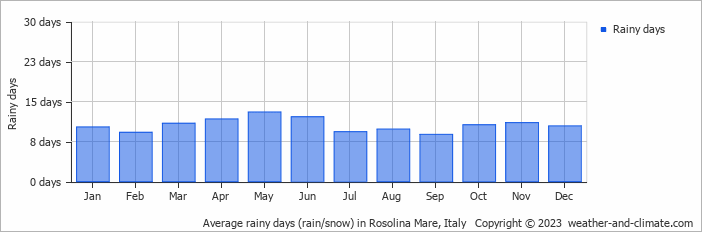
The average number of days each month with precipitation (> 0.2 mm (0.01 in))
Rosolina Mare experiences moderate seasonal variation in rainfall, with monthly averages ranging from 109 mm (4.3 in) in September, the wettest month, and 58 mm (2.3 in) in January, the driest month.
September, the wettest month, has a maximum daytime temperature of 24°C (75°F). The city receives 198 hours of sunshine in this period. During the driest month January you can expect a temperature of 9°C (48°F). For more detailed insights into the city's temperatures, visit our Rosolina Mare Temperature page.
Daily Historical Precipitation
Average daily rainfall for each day of the month based on long-term records. 50-year average (1976-2025)
Average precipitation in July
Explore Rosolina Mare's Historical Precipitation: 1976-2026
Browse day-by-day precipitation records for Rosolina Mare spanning 51 years. Select any month and year to see actual rainfall and snowfall recorded on each day.
Annual Rainfall in Italy: City Comparison
The map below shows the annual precipitation across Italy. You can also select the different months in case you are interested in a specific month.
Rosolina Mare vs World: Rainfall Compared
Rosolina Mare's average annual precipitation is 952 mm (37 in). Let's compare this to some popular worldwide tourist destinations:
Seville, Spain, experiences 541 mm (21 in) of rainfall annually, with wet winters and dry summers typical of southern Spain.
Meanwhile, Buenos Aires, Argentina, enjoys a humid subtropical climate with 1000 mm (39 in) of annual rainfall, mostly in the summer.
Perth, Australia, receives 565 mm (22 in) of rainfall annually, mostly during the winter months.
Singapore, situated near the equator, gets 2581 mm (102 in) of rainfall annually, with no distinct dry season and consistent monthly precipitation.
Precipitation amounts are measured using specific gauges installed at weather stations, collecting both rain and snow and any other type of precipitation. Rainfall is measured directly in millimeters, while that from snow and ice is obtained by melting it. Automated systems often incorporate heaters to make this easier.
Information from these stations is transmitted via Wi-Fi, satellite, GPS, or telephone connections to central monitoring networks. This information is immediately updated and integrated into weather models and forecasts.
Climate change is affecting precipitation patterns worldwide, including Rosolina Mare:
- Changing Rainfall Patterns: Global warming causes drastic changes in the patterns of rainfall. Some areas have been experiencing increased frequency and intensity of rainfall, while other areas experience longer dry spells or even droughts.
- Local Impacts: Many regions are experiencing heavier rainfall in the winter months and drier, hotter summers. This affects agriculture, water resources, and ecosystems.
- The U.S. has a significant number of thunderstorms every year, with over 14.6 million taking place across the world annually.
- Approximately 70% of lightning bolts strike land rather than oceans.
- A storm named John was the longest-lasting Pacific tropical storm, continuing for 31 days. As it crossed the dateline twice, it changed status from a hurricane to a typhoon and back to a hurricane.
For more detailed information about Rosolina Mare's weather, including sunshine hours, humidity levels, and temperature data, visit our Rosolina Mare Climate page.
Rosolina Mare Weather by Month
Pick a month to see the average temperature, rainfall and sunshine in Rosolina Mare - and find the best time to visit.
Rosolina Mare 3-Day Forecast
Temperature Rainfall Sunshine Humidity
See the full Rosolina Mare climate overview or explore weather in Italy.
Popular this month
Where to go in July - average daytime high across popular destinations.
Bucket list
Need travel inspiration? Check out our bucket list articles and be inspired.
 The 10 most beautiful historical towns in Italy
Discover Italy's top 10 historic towns, featuring breathtaking medieval architecture and deep-rooted history, ideal for enthusiasts of extraordinary cities.
Experience mystical Assisi
Assisi is the most famous town in Umbria and best known because of Saints Francis and Clare of Assisi. Many visitors come to see the breathtaking San Francesco basilica.
The Battle of Oranges
This is one of the most unusual festivals in Italy. The festival is held in the middle of winter during the winter carnival. The entire city of Ivrea near Turin turns into a battlefield.
The most beautiful fishing village of Italy
Portofino is the most beautiful fishing village in Italy and maybe even in the world. We absolutely recommend that you add this beautiful place to your bucket list.