















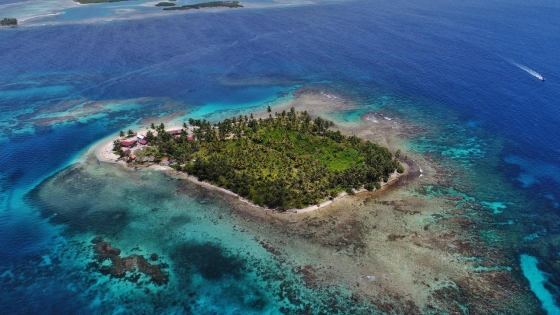
 Discover the San Blas Islands
The San Blas Islands are among the most beautiful islands in the Caribbean and perhaps even in the world. These tropical pearls are located in the north of Panama.
This page shows both the average monthly rainfall and the number of rainy days in Punta Laurel, Bocas del Toro, Panama. This average is based on long-term data collected between 1990 and 2020. Now, let's break down all the details for a clearer picture.
Punta Laurel experiences significant rainfall throughout the year, averaging 3115 mm (123 in) of precipitation annually.

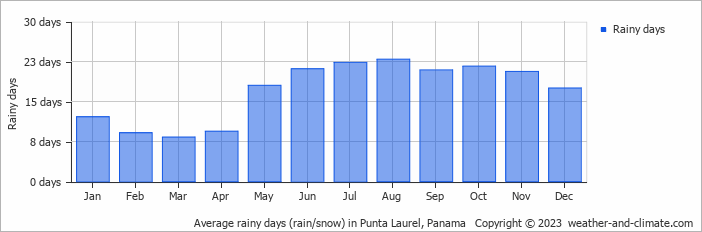
The climate in Punta Laurel shows significant variation throughout the year. Expect 407 mm (16 in) of precipitation during the wettest month November, distributed over 21 rainy days.
In contrast, March offers drier and sunnier days, with around 153 mm (6 in) of rainfall over 8 rainy days.
November, the wettest month, has a maximum daytime temperature of 28°C (82°F). The city receives 150 hours of sunshine in this period. During the driest month March you can expect a temperature of 28°C (82°F). For more detailed insights into the city's temperatures, visit our Punta Laurel Temperature page.
Browse day-by-day precipitation records for Punta Laurel spanning 51 years. Select any month and year to see actual rainfall and snowfall recorded on each day.
The map below shows the annual precipitation across Panama. You can also select the different months in case you are interested in a specific month.
Punta Laurel's average annual precipitation is 3115 mm (123 in). Let's compare this to some popular worldwide tourist destinations:
In Barcelona, Spain, the average annual precipitation is 620 mm (24 in), evenly distributed across the year with no extreme wet or dry seasons.
In Shanghai, China, the annual average precipitation is 1347 mm (53 in), with a humid subtropical climate.
In Brisbane, Australia, the annual precipitation is 979 mm (39 in), making it wetter than Sydney.
Bangkok, Thailand, experiences a tropical monsoon climate with 1668 mm (66 in) of annual rainfall, with the heaviest precipitation occurring during September and October.
Precipitation amounts are measured using specific gauges installed at weather stations, collecting both rain and snow and any other type of precipitation. Rainfall is measured directly in millimeters, while that from snow and ice is obtained by melting it. Automated systems often incorporate heaters to make this easier.
Information from these stations is transmitted via Wi-Fi, satellite, GPS, or telephone connections to central monitoring networks. This information is immediately updated and integrated into weather models and forecasts.
Precipitation has a very strong role in determining the local climate and ecosystem:
For more detailed information about Punta Laurel's weather, including sunshine hours, humidity levels, and temperature data, visit our Punta Laurel Climate page.
Pick a month to see the average temperature, rainfall and sunshine in Punta Laurel - and find the best time to visit.
Temperature Rainfall Sunshine Humidity
See the full Punta Laurel climate overview or explore weather in Panama.
Where to go in October - average daytime high across popular destinations.
Pedasí 30°C (86°F) Santa Catalina29°C (84°F) Playa Blanca29°C (84°F) Bastimentos29°C (84°F) Panama City30°C (86°F) Bocas del Toro30°C (86°F) Contadora29°C (84°F) Boquete26°C (79°F)
Need travel inspiration? Check out our bucket list articles and be inspired.
Discover the San Blas Islands
The San Blas Islands are among the most beautiful islands in the Caribbean and perhaps even in the world. These tropical pearls are located in the north of Panama.
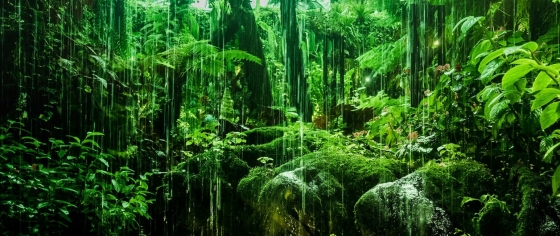
 The top 5 unexplored rainforests in Central America
Dive into Central America's top 5 hidden rainforests for an unparalleled journey through vibrant wildlife and diverse landscapes.
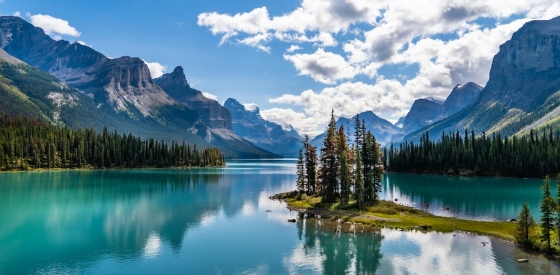
 The 5 most beautiful lakes in Canada
Explore Canada's stunning lakes: Lake Louise, Lake Superior, Maligne Lake, Emerald Lake, and Lake Okanagan, each offering unique beauty and activities.
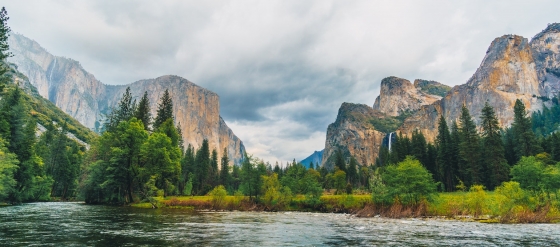
 Yosemite National Park is definitely worth a visit
Vast forests, blue lakes, towering sequoias, and majestic waterfalls hint at the beauty of Yosemite National Park—a true natural masterpiece.