Olongapo Monthly Rainfall & Precipitation
This page shows both the average monthly rainfall and the number of rainy days in Olongapo, Luzon, Philippines. Long-term data from 1990 to 2020 was used to calculate these averages. Now, let's break down all the details for a clearer picture.
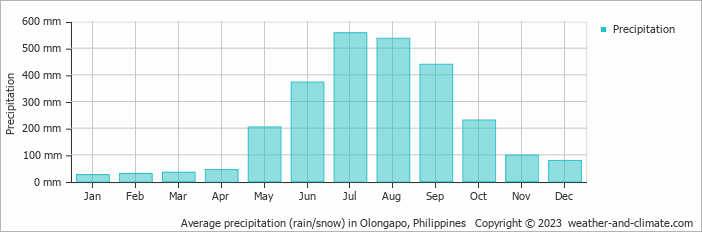
Olongapo has a relatively rainy climate with high precipitation levels, averaging 2647 mm (104 in) of rainfall annually. Despite the high annual total, it does experience a distinct dry and rainy season during certain months. Examine our detailed charts below to understand these seasonal patterns.
Monthly Rainfall & Rainy Days
Monthly Precipitation Levels
The average number of days each month with precipitation (> 0.2 mm (0.01 in))
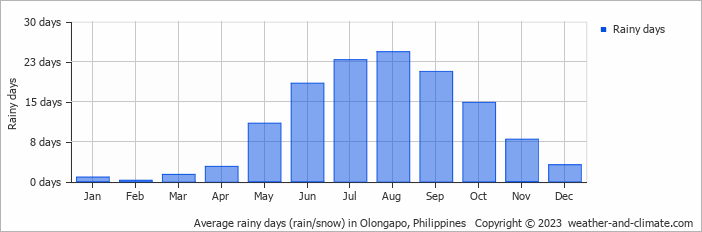
Significant seasonal changes in precipitation occur throughout the year. During the wettest month, July receives substantial rainfall, averaging 557 mm (22 in) of precipitation, recorded across 23 rainy days.
In contrast, the driest month, January brings less rainfall, with 25 mm (1 in) over a single rainy day.
July, the wettest month, has a maximum daytime temperature of 30°C (86°F). During the driest month January you can expect a temperature of 30°C (86°F). For more detailed insights into the city's temperatures, visit our Olongapo Temperature page.
Daily Historical Precipitation
Average daily rainfall for each day of the month based on long-term records. 49-year average (1976-2025)
Average precipitation in July
Explore Olongapo's Historical Precipitation: 1976-2026
Browse day-by-day precipitation records for Olongapo spanning 51 years. Select any month and year to see actual rainfall and snowfall recorded on each day.
Annual Rainfall in Philippines: City Comparison
The map below shows the annual precipitation across Philippines. You can also select the different months in case you are interested in a specific month.
Olongapo vs World: Rainfall Compared
Olongapo's average annual precipitation is 2647 mm (104 in). Let's compare this to some popular worldwide tourist destinations:
The city of Rome, Italy, has an average annual precipitation of 832 mm (33 in), spread fairly evenly throughout the year.
In Shanghai, China, the annual average precipitation is 1347 mm (53 in), with a humid subtropical climate.
Adelaide, Australia, enjoys 511 mm (20 in) of annual precipitation, with dry summers and wet winters.
Singapore, situated near the equator, gets 2581 mm (102 in) of rainfall annually, with no distinct dry season and consistent monthly precipitation.
Precipitation amounts are measured using specific gauges installed at weather stations, collecting both rain and snow and any other type of precipitation. Rainfall is measured directly in millimeters, while that from snow and ice is obtained by melting it. Automated systems often incorporate heaters to make this easier.
Information from these stations is transmitted via Wi-Fi, satellite, GPS, or telephone connections to central monitoring networks. This information is immediately updated and integrated into weather models and forecasts.
Precipitation has a very strong role in determining the local climate and ecosystem:
- Changing Rainfall Patterns: Global warming causes drastic changes in the patterns of rainfall. Some areas have been experiencing increased frequency and intensity of rainfall, while other areas experience longer dry spells or even droughts.
- Local Impacts: Many regions are experiencing heavier rainfall in the winter months and drier, hotter summers. This affects agriculture, water resources, and ecosystems.
- "Ginger" was the longest-lasting Atlantic tropical storm, which spun around the open ocean for 28 days in 1971.
- The world's largest snowflake was recorded in the Guinness Book of Records, at 38 cm (15 inches) wide and 20 cm (7.9 inches) thick. The snowflake fell at Fort Keogh, Montana, USA, on 28 January 1887.
- The greatest snowfall recorded was on Mt. Rainier, Washington State, USA, over 31.5 meters (103 feet) fell during the winter of 1972.
For more detailed information about Olongapo's weather, including sunshine hours, humidity levels, and temperature data, visit our Olongapo Climate page.
Olongapo Weather by Month
Pick a month to see the average temperature, rainfall and sunshine in Olongapo - and find the best time to visit.
Olongapo 3-Day Forecast
Temperature Rainfall Humidity
See the full Olongapo climate overview or explore weather in Philippines.
Popular this month
Where to go in July - average daytime high across popular destinations.
Bucket list
Need travel inspiration? Check out our bucket list articles and be inspired.
 10 Hidden gems in Asia you need to visit
Explore 10 hidden gems in Asia offering authentic experiences, from pristine beaches and remote islands to cultural treks and peaceful mountain villages.
 The 10 Most Exquisite Beaches in the Philippines
Explore the top 10 breathtaking beaches in the Philippines, from serene Nacpan Beach to volcanic Camiguin Island, in our detailed guide.
Siquijor island, the island of magic, fireflies, small breathtaking bays and so much more
All the islands of the Philippines are beautiful, however Siquijor island stands out. It is the island of magic, fireflies, small breathtaking bays and so much more.
Stay at a 100% self-sustaining island resort
Coron was one of our favorite destinations in the world. The beauty of this island combined with the amazing hospitality and smiles of the Filipinos is a golden combination.