Okayama Monthly Rainfall & Precipitation
This page shows both the average monthly rainfall and the number of rainy days in Okayama, Okayama, Japan. These averages rely on historical data collected over 30 years, from 1990 to 2020. Now, let's break down all the details for a clearer picture.
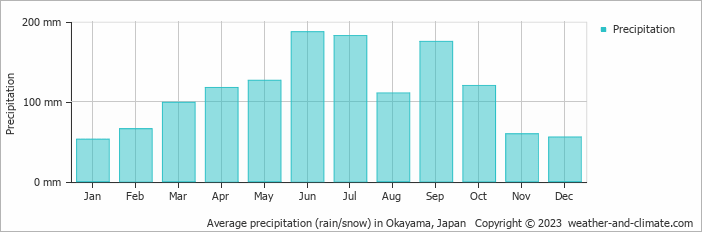
Okayama experiences significant rain/snowfall throughout the year, averaging 1350 mm (53 in) of precipitation annually.
Monthly Rainfall & Rainy Days
Monthly Precipitation Levels
The average number of days each month with precipitation (> 0.2 mm (0.01 in))
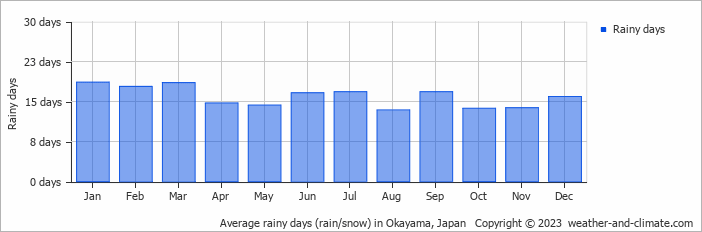
The climate in Okayama shows significant variation throughout the year. Expect 187 mm (7.4 in) of precipitation during the wettest month June, distributed over 17 rainy days.
In contrast, January offers drier and sunnier days, with around 53 mm (2.1 in) of rainfall over 19 rainy days.
June, the wettest month, has a maximum daytime temperature of 27°C (81°F). The city receives 155 hours of sunshine in this period. During the driest month January you can expect a temperature of 11°C (52°F). For more detailed insights into the city's temperatures, visit our Okayama Temperature page.
Daily Historical Precipitation
Average daily rainfall for each day of the month based on long-term records. 50-year average (1976-2025)
Average precipitation in September
Explore Okayama's Historical Precipitation: 1976-2026
Browse day-by-day precipitation records for Okayama spanning 51 years. Select any month and year to see actual rainfall and snowfall recorded on each day.
Annual Rainfall in Japan: City Comparison
The map below shows the annual precipitation across Japan. You can also select the different months in case you are interested in a specific month.
Okayama vs World: Rainfall Compared
Okayama's average annual precipitation is 1350 mm (53 in). Let's compare this to some popular worldwide tourist destinations:
The climate in San Francisco, USA, is influenced by coastal weather, with 469 mm (18 in) of rainfall mostly during the winter months.
Osaka, Japan, experiences 1507 mm (59 in) of rainfall annually, spread across the year with wetter summers.
Adelaide, Australia, enjoys 511 mm (20 in) of annual precipitation, with dry summers and wet winters.
Kuala Lumpur, Malaysia, receives 2529 mm (100 in) of annual rainfall, characteristic of its equatorial tropical rainforest climate, with consistent rainfall throughout the year and peak months during March and November.
Precipitation amounts are measured using specific gauges installed at weather stations, collecting both rain and snow and any other type of precipitation. Rainfall is measured directly in millimeters, while that from snow and ice is obtained by melting it. Automated systems often incorporate heaters to make this easier.
Information from these stations is transmitted via Wi-Fi, satellite, GPS, or telephone connections to central monitoring networks. This information is immediately updated and integrated into weather models and forecasts.
Climate change is affecting precipitation patterns worldwide, including Okayama:
- Changing Rainfall Patterns: Global warming causes drastic changes in the patterns of rainfall. Some areas have been experiencing increased frequency and intensity of rainfall, while other areas experience longer dry spells or even droughts.
- Local Impacts: Many regions are experiencing heavier rainfall in the winter months and drier, hotter summers. This affects agriculture, water resources, and ecosystems.
- "Ginger" was the longest-lasting Atlantic tropical storm, which spun around the open ocean for 28 days in 1971.
- The world's largest snowflake was recorded in the Guinness Book of Records, at 38 cm (15 inches) wide and 20 cm (7.9 inches) thick. The snowflake fell at Fort Keogh, Montana, USA, on 28 January 1887.
- The greatest snowfall recorded was on Mt. Rainier, Washington State, USA, over 31.5 meters (103 feet) fell during the winter of 1972.
For more detailed information about Okayama's weather, including sunshine hours, humidity levels, and temperature data, visit our Okayama Climate page.
Okayama Weather by Month
Pick a month to see the average temperature, rainfall and sunshine in Okayama - and find the best time to visit.




Okayama 3-Day Forecast
Temperature Rainfall Sunshine Humidity
See the full Okayama climate overview or explore weather in Japan.
Popular this month
Where to go in September - average daytime high across popular destinations.
















Bucket list
Need travel inspiration? Check out our bucket list articles and be inspired.
 Chase the autumn leaves in Japan
Japan is one of these cases which turns into a gold, yellow and orange fairy tale starting from September. And we can honestly say: We cannot imagine a more beautiful season to visit Japan.
Walk the 88 temple circuit
We recommend walking the 88 temple circuit from April til October. Although June, July and August can be a bit wet, hot and humid.
The famous bamboo forests of Arashiyama
The famous bamboo forests of Arashiyama lie just outside the city center of Kyoto and is unique in the world. If you look at photos of this bamboo forest, it looks like you have landed in a fairy-tale world.
10 reasons why you should visit Japan in winter
Here are 10 reasons why you should plan a winter trip to Japan. During this period, popular sights are less busy and prices for flights and hotels much cheaper.