

















 Warm Sea Without Extreme Heat: 8 Beach Destinations With Comfortable Weather
Love warm seawater but not extreme heat? Compare eight beach destinations where the sea stays warm while daytime temperatures remain comfortable.
This page shows both the average monthly rainfall and the number of rainy days in La Lantejuela, Andalucía, Spain. This average is based on long-term data collected between 1990 and 2020. Let's explore the details to provide you with a complete overview.
La Lantejuela maintains relatively dry conditions year-round, with an average annual precipitation of 471 mm (19 in). However, it does have a distinct dry season during certain months, creating distinct seasonal patterns visible in our monthly breakdown below.
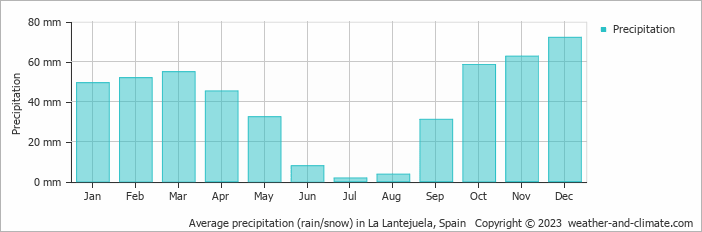
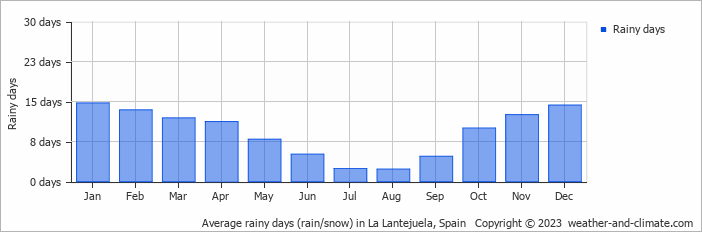
La Lantejuela can be quite wet during December, receiving approximately 72 mm (2.8 in) of precipitation over 14 rainy days.
In contrast July, experiences much drier conditions, with 1.7 mm (0.1 in) of rainfall, spread across 2 rainy days.
December, the wettest month, has a maximum daytime temperature of 17°C (63°F). The city receives 155 hours of sunshine in this period. During the driest month July you can expect a temperature of 36°C (97°F). For more detailed insights into the city's temperatures, visit our La Lantejuela Temperature page.
The map below shows the annual precipitation across Spain. You can also select the different months in case you are interested in a specific month.
La Lantejuela's average annual precipitation is 471 mm (19 in). Let's compare this to some popular worldwide tourist destinations:
New York City, USA, receives 1276 mm (50 in) of rainfall annually, with precipitation evenly distributed throughout the year.
Beijing, China, receives 560 mm (22 in) of annual precipitation, concentrated in the summer months.
Melbourne, Australia, has 690 mm (27 in) of rainfall annually, spread fairly evenly throughout the year.
Ho Chi Minh City, Vietnam, receives 1955 mm (77 in) of annual rainfall, with a pronounced wet season from May to November, typical of its tropical monsoon climate.
Precipitation amounts are measured using specific gauges installed at weather stations, collecting both rain and snow and any other type of precipitation. Rainfall is measured directly in millimeters, while that from snow and ice is obtained by melting it. Automated systems often incorporate heaters to make this easier.
Information from these stations is transmitted via Wi-Fi, satellite, GPS, or telephone connections to central monitoring networks. This information is immediately updated and integrated into weather models and forecasts.
The proximity of a location to a large body of water can significantly affect its rainfall patterns:
For more detailed information about La Lantejuela's weather, including sunshine hours, humidity levels, and temperature data, visit our La Lantejuela Climate page.
Pick a month to see the average temperature, rainfall and sunshine in La Lantejuela - and find the best time to visit.
Temperature Rainfall Sunshine Humidity
See the full La Lantejuela climate overview or explore weather in Spain.
Where to go in October - average daytime high across popular destinations.
Need travel inspiration? Check out our bucket list articles and be inspired.
Warm Sea Without Extreme Heat: 8 Beach Destinations With Comfortable Weather
Love warm seawater but not extreme heat? Compare eight beach destinations where the sea stays warm while daytime temperatures remain comfortable.

 El Hierro: The smallest Canary island without mass tourism
Mainly nature lovers and those seeking tranquility go to El Hierro. The island is know for its beautiful mountains and you can wonder around for days here.
 Spain in October: Where Is It Warmest and Sunniest?
Discover where Spain is warmest in October, with climate comparisons for Seville, Alicante, Málaga, Tenerife, Madrid and Barcelona.
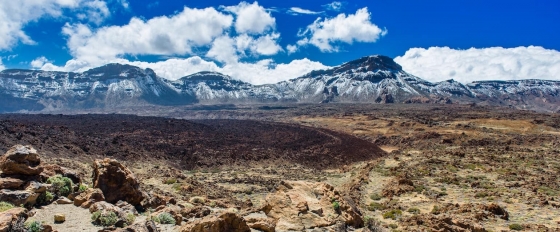 Visit national Park El Teide
This national park is truly a unique place that you should not miss. You will find landscapes that seem to come from another plane and you will feel tiny in these impressive surroundings.