Khālāpur Monthly Rainfall & Precipitation
This page shows both the average monthly rainfall and the number of rainy days in Khālāpur, India. The numbers reflect climate data gathered over a 30-year period, from 1990 to 2020. Now, let's explore all the details to give you a full picture.
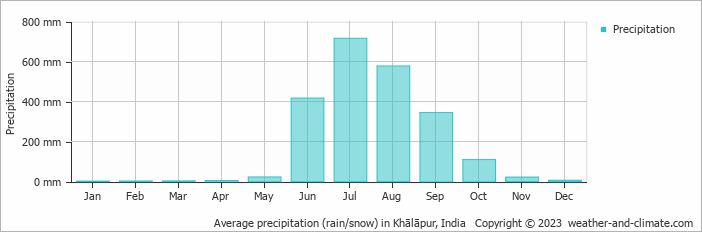
Khālāpur experiences significant rainfall throughout the year, averaging 2217 mm (87 in) of precipitation annually. However, this abundant rainfall is not evenly distributed, with a distinct dry and rainy season during certain months. You can clearly see this in our monthly precipitation graphs below.
Monthly Rainfall & Rainy Days
Monthly Precipitation Levels
The average number of days each month with precipitation (> 0.2 mm (0.01 in))
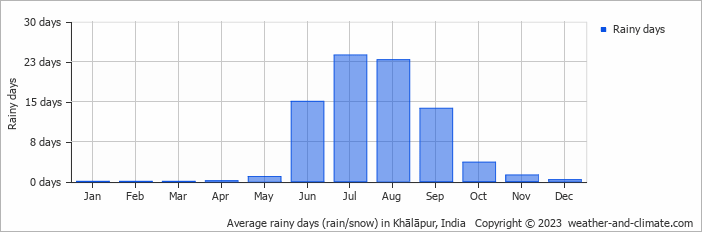
Khālāpur can be quite wet during July, receiving approximately 715 mm (28 in) of precipitation over 24 rainy days.
In contrast January, experiences much drier conditions, with 0.9 mm (0.04 in) of rainfall, spread across 0 rainy days.
July, the wettest month, has a maximum daytime temperature of 29°C (84°F). The city receives 73 hours of sunshine in this period. During the driest month January you can expect a temperature of 32°C (90°F). For more detailed insights into the city's temperatures, visit our Khālāpur Temperature page.
Annual Rainfall in India: City Comparison
The map below shows the annual precipitation across India. You can also select the different months in case you are interested in a specific month.
Khālāpur vs World: Rainfall Compared
Khālāpur's average annual precipitation is 2217 mm (87 in). Let's compare this to some popular worldwide tourist destinations:
Seville, Spain, experiences 541 mm (21 in) of rainfall annually, with wet winters and dry summers typical of southern Spain.
In Seoul, South Korea, the average annual precipitation is 1237 mm (49 in), with most rain falling during the summer monsoon season.
Melbourne, Australia, has 690 mm (27 in) of rainfall annually, spread fairly evenly throughout the year.
Mumbai, India, experiences a tropical monsoon climate with 1860 mm (73 in) of annual rainfall, with the majority of precipitation happening during the monsoon season from June to September.
Precipitation amounts are measured using specific gauges installed at weather stations, collecting both rain and snow and any other type of precipitation. Rainfall is measured directly in millimeters, while that from snow and ice is obtained by melting it. Automated systems often incorporate heaters to make this easier.
Information from these stations is transmitted via Wi-Fi, satellite, GPS, or telephone connections to central monitoring networks. This information is immediately updated and integrated into weather models and forecasts.
Precipitation has a very strong role in determining the local climate and ecosystem:
- Changing Rainfall Patterns: Global warming causes drastic changes in the patterns of rainfall. Some areas have been experiencing increased frequency and intensity of rainfall, while other areas experience longer dry spells or even droughts.
- Local Impacts: Many regions are experiencing heavier rainfall in the winter months and drier, hotter summers. This affects agriculture, water resources, and ecosystems.
- Mawsynram in India is noted as being the wettest place on earth, with over 11 meters (36 feet) of rain falling every year.
- In contrast, Antofagasta in Chile is among the driest places on the planet, getting less than 0.1mm (0.004 inches) per year, with some years recording virtually no rainfall.
- Nearly 1,650 thunderstorm cells are estimated over the planet at any given time.
For more detailed information about Khālāpur's weather, including sunshine hours, humidity levels, and temperature data, visit our Khālāpur Climate page.
Khālāpur Weather by Month
Pick a month to see the average temperature, rainfall and sunshine in Khālāpur - and find the best time to visit.
Khālāpur 3-Day Forecast
Temperature Rainfall Sunshine Humidity
See the full Khālāpur climate overview or explore weather in India.
Popular this month
Where to go in July - average daytime high across popular destinations.
Bucket list
Need travel inspiration? Check out our bucket list articles and be inspired.
 A paradise called Andaman Islands
Though officially Indian, the Andamans are nearer Myanmar, Indonesia, and Thailand, resulting in amazing, budget-friendly white-sand beaches.
The 5 most beautiful monasteries in Ladakh
Explore Ladakh's spiritual essence through its incredible Buddhist monasteries. See architectural wonders, rich traditions, and serene landscapes in this guide.
Sleeping under the stars and riding camels in Rajasthan
A desert safari in Jaisalmer is definitely one of the highlights during a visit to India. Spending a night in the desert is a great adventurous bucket list experience.
Avoid mass tourism on an eco boat in the backwaters of Kerala
We can tell you now how you can avoid being surrounded by tourists and at the same time minimize your impact on the environment.