Karfas Monthly Rainfall & Precipitation
This page shows both the average monthly rainfall and the number of rainy days in Karfas, Chios Island, Greece. The numbers reflect climate data gathered over a 30-year period, from 1990 to 2020. Now, let's break down all the details for a clearer picture.
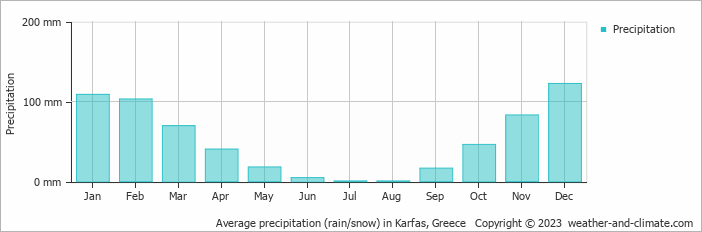
Generally, Karfas has a moderate amount of precipitation, averaging 613 mm (24 in) of rainfall annually. However, it does experience a distinct dry season during certain months. Take a look at our detailed charts below to see the seasonal variation.
Monthly Rainfall & Rainy Days
Monthly Precipitation Levels
The average number of days each month with precipitation (> 0.2 mm (0.01 in))
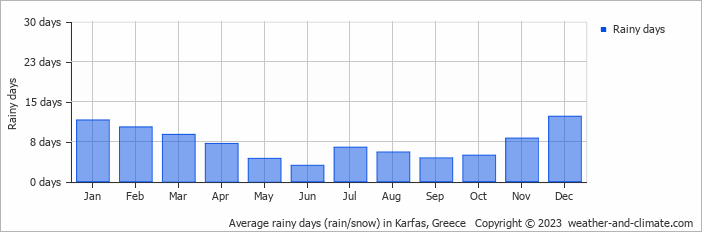
Significant seasonal changes in precipitation occur throughout the year. During the wettest month, December receives substantial rainfall, averaging 122 mm (4.8 in) of precipitation, recorded across 12 rainy days.
In contrast, the driest month, July brings less rainfall, with 0.6 mm (0.02 in) over 6 rainy days.
December, the wettest month, has a maximum daytime temperature of 15°C (59°F). During the driest month July you can expect a temperature of 30°C (86°F). For more detailed insights into the city's temperatures, visit our Karfas Temperature page.
Annual Rainfall in Greece: City Comparison
The map below shows the annual precipitation across Greece. You can also select the different months in case you are interested in a specific month.
Karfas vs World: Rainfall Compared
Karfas's average annual precipitation is 613 mm (24 in). Let's compare this to some popular worldwide tourist destinations:
In Barcelona, Spain, the average annual precipitation is 620 mm (24 in), evenly distributed across the year with no extreme wet or dry seasons.
Osaka, Japan, experiences 1507 mm (59 in) of rainfall annually, spread across the year with wetter summers.
In Brisbane, Australia, the annual precipitation is 979 mm (39 in), making it wetter than Sydney.
Bangkok, Thailand, experiences a tropical monsoon climate with 1668 mm (66 in) of annual rainfall, with the heaviest precipitation occurring during September and October.
Precipitation amounts are measured using specific gauges installed at weather stations, collecting both rain and snow and any other type of precipitation. Rainfall is measured directly in millimeters, while that from snow and ice is obtained by melting it. Automated systems often incorporate heaters to make this easier.
Information from these stations is transmitted via Wi-Fi, satellite, GPS, or telephone connections to central monitoring networks. This information is immediately updated and integrated into weather models and forecasts.
Climate change is affecting precipitation patterns worldwide, including Karfas:
- Changing Rainfall Patterns: Global warming causes drastic changes in the patterns of rainfall. Some areas have been experiencing increased frequency and intensity of rainfall, while other areas experience longer dry spells or even droughts.
- Local Impacts: Many regions are experiencing heavier rainfall in the winter months and drier, hotter summers. This affects agriculture, water resources, and ecosystems.
- "Ginger" was the longest-lasting Atlantic tropical storm, which spun around the open ocean for 28 days in 1971.
- The world's largest snowflake was recorded in the Guinness Book of Records, at 38 cm (15 inches) wide and 20 cm (7.9 inches) thick. The snowflake fell at Fort Keogh, Montana, USA, on 28 January 1887.
- The greatest snowfall recorded was on Mt. Rainier, Washington State, USA, over 31.5 meters (103 feet) fell during the winter of 1972.
For more detailed information about Karfas's weather, including sunshine hours, humidity levels, and temperature data, visit our Karfas Climate page.
Karfas Weather by Month
Pick a month to see the average temperature, rainfall and sunshine in Karfas - and find the best time to visit.
Karfas 3-Day Forecast
Temperature Rainfall Humidity Water Temp
See the full Karfas climate overview or explore weather in Greece.
Popular this month
Where to go in July - average daytime high across popular destinations.
Bucket list
Need travel inspiration? Check out our bucket list articles and be inspired.
 Top 5 secluded beaches in Greece
Explore Greece's hidden gems: secluded beaches like Fokos, Seychelles, Potami, Kedrodasos, and Mouros for tranquil adventures away from crowds.
Discover Zakynthos
On the Greek island you can discover the rugged coastline, authentic old villages, a beautiful interior and the caves with the beautiful azure water.
Why Santorini should be on every Bucket List
This Greek island is home to some of the most stunning scenery globally, with its beautiful Caldera views, white-washed houses and crystal-clear waters.