Karbunara e Vogël Monthly Rainfall & Precipitation
This page shows both the average monthly rainfall and the number of rainy days in Karbunara e Vogël, Albania. These averages rely on historical data collected over 30 years, from 1990 to 2020. Let's explore the details to provide you with a complete overview.
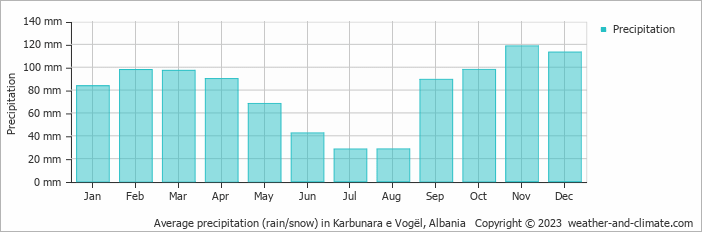
Generally, Karbunara e Vogël receives mid-range precipitation levels, with 954 mm (38 in) annually. The distribution varies significantly throughout the year, with a distinct dry season during certain months, as shown in our charts below.
Monthly Precipitation Levels
The average number of days each month with precipitation (> 0.2 mm (0.01 in))
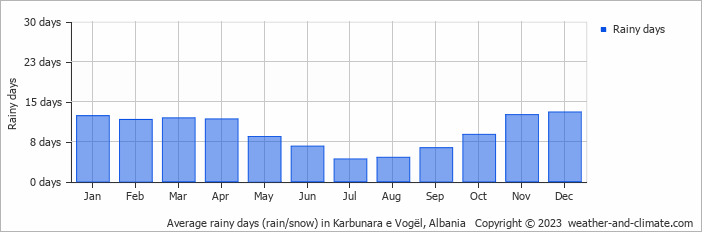
The seasons in Karbunara e Vogël, bring significant changes in precipitation. The wettest month, November, receives high rainfall, with an average of 119 mm (4.7 in) of precipitation. This rainfall is distributed across 13 rainy days.
In contrast, the driest month, July, experiences much less rainfall, totaling 28 mm (1.1 in) over 4 rainy days. These distinct seasonal differences provide diverse experiences throughout the year.November, the wettest month, has a maximum daytime temperature of 19°C (66°F). The city receives 103 hours of sunshine in this period. During the driest month July you can expect a temperature of 33°C (91°F). For more detailed insights into the city's temperatures, visit our Karbunara e Vogël Temperature page.
Daily Historical Precipitation
40-year average (1979-2025)
Average daily rainfall for each day of the month based on long-term records.
Average precipitation in July
Explore Karbunara e Vogël's Historical Precipitation: 1976-2026
Browse day-by-day precipitation records for Karbunara e Vogël spanning 51 years. Select any month and year to see actual rainfall and snowfall recorded on each day.
Annual Rainfall in Albania: City Comparison
The map below shows the annual precipitation across Albania. You can also select the different months in case you are interested in a specific month.
 heavy rainfall
 high
high
 moderate
 low
low
 almost none
Karbunara e Vogël vs World: Rainfall Compared
Karbunara e Vogël's average annual precipitation is 954 mm (38 in). Let's compare this to some popular worldwide tourist destinations:
New York City, USA, receives 1276 mm (50 in) of rainfall annually, with precipitation evenly distributed throughout the year.
In Seoul, South Korea, the average annual precipitation is 1237 mm (49 in), with most rain falling during the summer monsoon season.
In Tokyo, Japan, the average annual precipitation is 1528 mm (60 in), with significant summer rains due to typhoon season.
Singapore, situated near the equator, gets 2581 mm (102 in) of rainfall annually, with no distinct dry season and consistent monthly precipitation.
Precipitation amounts are measured using specific gauges installed at weather stations, collecting both rain and snow and any other type of precipitation. Rainfall is measured directly in millimeters, while that from snow and ice is obtained by melting it. Automated systems often incorporate heaters to make this easier.
Information from these stations is transmitted via Wi-Fi, satellite, GPS, or telephone connections to central monitoring networks. This information is immediately updated and integrated into weather models and forecasts.
- Mawsynram in India is noted as being the wettest place on earth, with over 11 meters (36 feet) of rain falling every year.
- In contrast, Antofagasta in Chile is among the driest places on the planet, getting less than 0.1mm (0.004 inches) per year, with some years recording virtually no rainfall.
- Nearly 1,650 thunderstorm cells are estimated over the planet at any given time.
For more detailed information about Karbunara e Vogël's weather, including sunshine hours, humidity levels, and temperature data, visit our Karbunara e Vogël Climate page.