














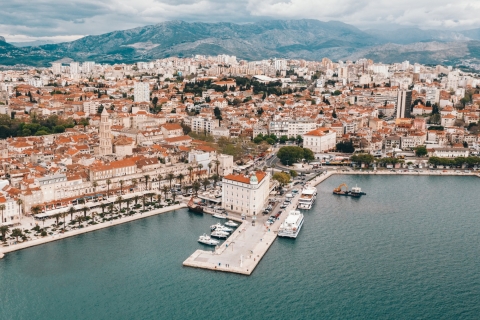
 Magical Split
The best travel time to Split in Croatia is from May til October and the best months are May, June and September.
This page shows both the average monthly rainfall and the number of rainy days in Gorica, Zadar County, Croatia. These averages rely on historical data collected over 30 years, from 1990 to 2020. Let's now guide you through the details for a complete overview.
Gorica has a notably wet climate with abundant precipitation, recording 1125 mm (44 in) of rainfall per year.
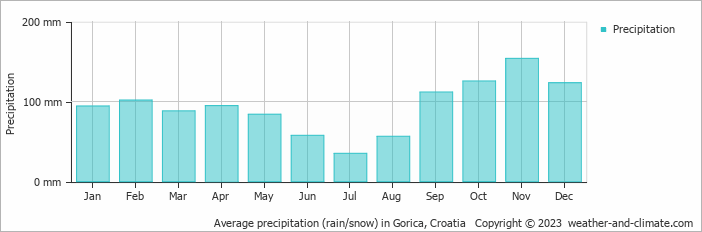
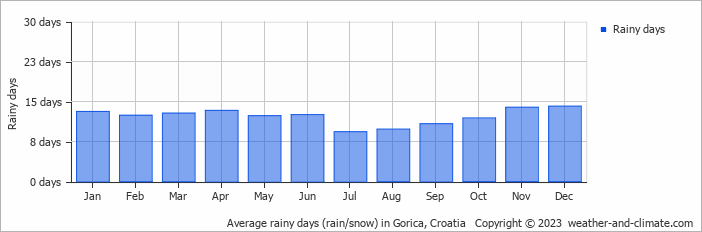
Significant seasonal changes in precipitation occur throughout the year. During the wettest month, November receives substantial rainfall, averaging 154 mm (6.1 in) of precipitation, recorded across 14 rainy days.
In contrast, the driest month, July brings less rainfall, with 35 mm (1.4 in) over 9 rainy days.
November, the wettest month, has a maximum daytime temperature of 16°C (61°F). The city receives 123 hours of sunshine in this period. During the driest month July you can expect a temperature of 32°C (90°F). For more detailed insights into the city's temperatures, visit our Gorica Temperature page.
The map below shows the annual precipitation across Croatia. You can also select the different months in case you are interested in a specific month.
Gorica's average annual precipitation is 1125 mm (44 in). Let's compare this to some popular worldwide tourist destinations:
The city of Rome, Italy, has an average annual precipitation of 832 mm (33 in), spread fairly evenly throughout the year.
Osaka, Japan, experiences 1507 mm (59 in) of rainfall annually, spread across the year with wetter summers.
Adelaide, Australia, enjoys 511 mm (20 in) of annual precipitation, with dry summers and wet winters.
Ho Chi Minh City, Vietnam, receives 1955 mm (77 in) of annual rainfall, with a pronounced wet season from May to November, typical of its tropical monsoon climate.
Precipitation amounts are measured using specific gauges installed at weather stations, collecting both rain and snow and any other type of precipitation. Rainfall is measured directly in millimeters, while that from snow and ice is obtained by melting it. Automated systems often incorporate heaters to make this easier.
Information from these stations is transmitted via Wi-Fi, satellite, GPS, or telephone connections to central monitoring networks. This information is immediately updated and integrated into weather models and forecasts.
Climate change is affecting precipitation patterns worldwide, including Gorica:
For more detailed information about Gorica's weather, including sunshine hours, humidity levels, and temperature data, visit our Gorica Climate page.
Pick a month to see the average temperature, rainfall and sunshine in Gorica - and find the best time to visit.
Temperature Rainfall Sunshine Humidity
See the full Gorica climate overview or explore weather in Croatia.
Where to go in October - average daytime high across popular destinations.
Trogir 20°C (68°F) Zadar
 21°C (70°F) Makarska
 20°C (68°F) Poreč19°C (66°F) Rovinj19°C (66°F) Pula19°C (66°F) Split20°C (68°F) Dubrovnik20°C (68°F)
 Need travel inspiration? Check out our bucket list articles and be inspired.
Magical Split
The best travel time to Split in Croatia is from May til October and the best months are May, June and September.
 Sail the crystal-clear waters of Croatia and enjoy its stunning coastline
Croatia is an idyllic sailing destination, boasting 1,777 miles (2,860 km) of beautiful beaches and pristine waters. With over 1,000 Islands dotting the Adriatic Sea, there's a perfect spot for everyone.
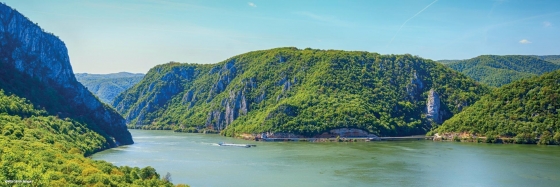
 Cycle the Danube trail
The Danube cycle route is one of the most popular cycling routes in Europe, and rightly so, because it is a varied route that is interesting both in terms of culture and nature.

 The 10 most charming villages in France
Discover France's top 10 beautiful villages. From Normandy to the Côte d'Azur, experience quaint squares and cobbled streets. Which one will you visit this summer?