

















 Warm Sea Without Extreme Heat: 8 Beach Destinations With Comfortable Weather
Love warm seawater but not extreme heat? Compare eight beach destinations where the sea stays warm while daytime temperatures remain comfortable.
This page shows both the average monthly rainfall and the number of rainy days in Fuente de Piedra, Andalucía, Spain. Long-term data from 1990 to 2020 was used to calculate these averages. Let's now guide you through the details for a complete overview.
On average, Fuente de Piedra receives a reasonable amount of rainfall, with an annual precipitation of 512 mm (20 in). Despite this overall moderate level, the city experiences distinct dry season during certain months throughout the year, as illustrated in the precipitation charts below.


The seasons in Fuente de Piedra, bring significant changes in precipitation. The wettest month, November, receives moderate rainfall, with an average of 71 mm (2.8 in) of precipitation. This rainfall is distributed across 13 rainy days.
In contrast, the driest month, July, experiences much less rainfall, totaling 2.6 mm (0.1 in) over 3 rainy days. These distinct seasonal differences provide diverse experiences throughout the year.November, the wettest month, has a maximum daytime temperature of 18°C (64°F). The city receives 170 hours of sunshine in this period. During the driest month July you can expect a temperature of 34°C (93°F). For more detailed insights into the city's temperatures, visit our Fuente de Piedra Temperature page.
The map below shows the annual precipitation across Spain. You can also select the different months in case you are interested in a specific month.
Fuente de Piedra's average annual precipitation is 512 mm (20 in). Let's compare this to some popular worldwide tourist destinations:
New York City, USA, receives 1276 mm (50 in) of rainfall annually, with precipitation evenly distributed throughout the year.
Osaka, Japan, experiences 1507 mm (59 in) of rainfall annually, spread across the year with wetter summers.
In Tokyo, Japan, the average annual precipitation is 1528 mm (60 in), with significant summer rains due to typhoon season.
Mumbai, India, experiences a tropical monsoon climate with 1860 mm (73 in) of annual rainfall, with the majority of precipitation happening during the monsoon season from June to September.
Precipitation amounts are measured using specific gauges installed at weather stations, collecting both rain and snow and any other type of precipitation. Rainfall is measured directly in millimeters, while that from snow and ice is obtained by melting it. Automated systems often incorporate heaters to make this easier.
Information from these stations is transmitted via Wi-Fi, satellite, GPS, or telephone connections to central monitoring networks. This information is immediately updated and integrated into weather models and forecasts.
Tropical Rainforests: In tropical regions, rainfall is generally abundant year-round. Areas near the equator, like the Amazon rainforest, can receive up to 3000 mm (118 in) of rain annually.
Desert Regions: Deserts such as the Sahara and Arabian deserts typically see less than 250 mm (9.8 in) of rainfall annually. Rainfall tends to be infrequent, but when it does occur, it is often intense.
Temperate Zones: In temperate regions, precipitation tends to be more evenly distributed, though areas closer to the ocean may see more rain in the winter months, and areas further inland experience drier summers.
Polar Regions: Precipitation in polar regions, like Antarctica, is extremely low, often falling as snow. Average annual precipitation in Antarctica is less than 200 mm (7.9 in), with some areas receiving as little as 50 mm (2 in) annually.
For more detailed information about Fuente de Piedra's weather, including sunshine hours, humidity levels, and temperature data, visit our Fuente de Piedra Climate page.
Pick a month to see the average temperature, rainfall and sunshine in Fuente de Piedra - and find the best time to visit.
Temperature Rainfall Sunshine Humidity
See the full Fuente de Piedra climate overview or explore weather in Spain.
Where to go in October - average daytime high across popular destinations.
Need travel inspiration? Check out our bucket list articles and be inspired.
Warm Sea Without Extreme Heat: 8 Beach Destinations With Comfortable Weather
Love warm seawater but not extreme heat? Compare eight beach destinations where the sea stays warm while daytime temperatures remain comfortable.

 El Hierro: The smallest Canary island without mass tourism
Mainly nature lovers and those seeking tranquility go to El Hierro. The island is know for its beautiful mountains and you can wonder around for days here.
 Spain in October: Where Is It Warmest and Sunniest?
Discover where Spain is warmest in October, with climate comparisons for Seville, Alicante, Málaga, Tenerife, Madrid and Barcelona.
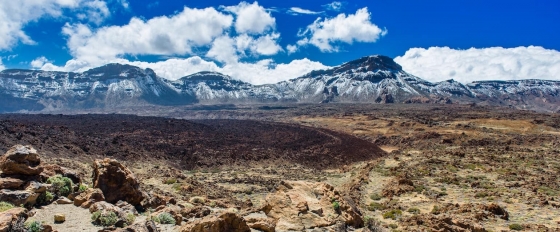 Visit national Park El Teide
This national park is truly a unique place that you should not miss. You will find landscapes that seem to come from another plane and you will feel tiny in these impressive surroundings.