Bogor Monthly Rainfall & Precipitation
This page shows both the average monthly rainfall and the number of rainy days in Bogor, West Java, Indonesia. Long-term data from 1990 to 2020 was used to calculate these averages. Now, let's explore all the details to give you a full picture.
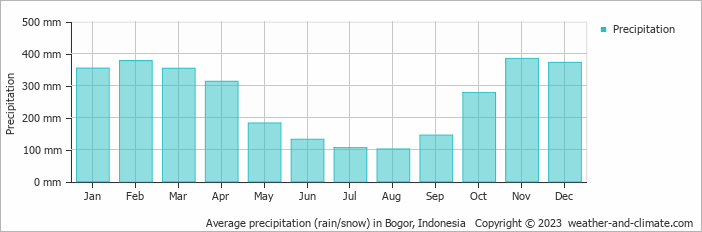
Bogor experiences significant rainfall throughout the year, averaging 3095 mm (122 in) of precipitation annually. However, this abundant rainfall is not evenly distributed, with a distinct rainy season during certain months. You can clearly see this in our monthly precipitation graphs below.
Monthly Rainfall & Rainy Days
Monthly Precipitation Levels
The average number of days each month with precipitation (> 0.2 mm (0.01 in))
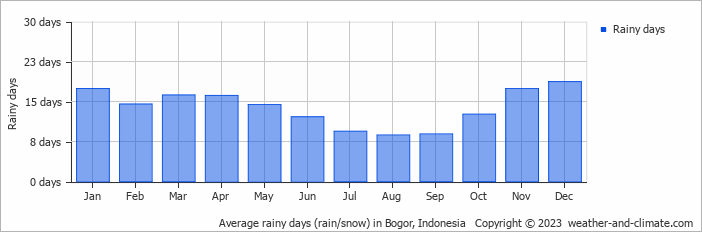
The climate in Bogor shows significant variation throughout the year. Expect 384 mm (15 in) of precipitation during the wettest month November, distributed over 17 rainy days.
In contrast, August offers drier and sunnier days, with around 101 mm (4 in) of rainfall over 9 rainy days.
November, the wettest month, has a maximum daytime temperature of 31°C (88°F). The city receives 231 hours of sunshine in this period. During the driest month August you can expect a temperature of 31°C (88°F). For more detailed insights into the city's temperatures, visit our Bogor Temperature page.
Daily Historical Precipitation
Average daily rainfall for each day of the month based on long-term records. 49-year average (1976-2025)
Average precipitation in July
Explore Bogor's Historical Precipitation: 1976-2026
Browse day-by-day precipitation records for Bogor spanning 51 years. Select any month and year to see actual rainfall and snowfall recorded on each day.
Annual Rainfall in Indonesia: City Comparison
The map below shows the annual precipitation across Indonesia. You can also select the different months in case you are interested in a specific month.
Bogor vs World: Rainfall Compared
Bogor's average annual precipitation is 3095 mm (122 in). Let's compare this to some popular worldwide tourist destinations:
New York City, USA, receives 1276 mm (50 in) of rainfall annually, with precipitation evenly distributed throughout the year.
In Shanghai, China, the annual average precipitation is 1347 mm (53 in), with a humid subtropical climate.
Perth, Australia, receives 565 mm (22 in) of rainfall annually, mostly during the winter months.
Kuala Lumpur, Malaysia, receives 2529 mm (100 in) of annual rainfall, characteristic of its equatorial tropical rainforest climate, with consistent rainfall throughout the year and peak months during March and November.
Precipitation amounts are measured using specific gauges installed at weather stations, collecting both rain and snow and any other type of precipitation. Rainfall is measured directly in millimeters, while that from snow and ice is obtained by melting it. Automated systems often incorporate heaters to make this easier.
Information from these stations is transmitted via Wi-Fi, satellite, GPS, or telephone connections to central monitoring networks. This information is immediately updated and integrated into weather models and forecasts.
Climate change is affecting precipitation patterns worldwide, including Bogor:
- Changing Rainfall Patterns: Global warming causes drastic changes in the patterns of rainfall. Some areas have been experiencing increased frequency and intensity of rainfall, while other areas experience longer dry spells or even droughts.
- Local Impacts: Many regions are experiencing heavier rainfall in the winter months and drier, hotter summers. This affects agriculture, water resources, and ecosystems.
- Mawsynram in India is noted as being the wettest place on earth, with over 11 meters (36 feet) of rain falling every year.
- In contrast, Antofagasta in Chile is among the driest places on the planet, getting less than 0.1mm (0.004 inches) per year, with some years recording virtually no rainfall.
- Nearly 1,650 thunderstorm cells are estimated over the planet at any given time.
For more detailed information about Bogor's weather, including sunshine hours, humidity levels, and temperature data, visit our Bogor Climate page.
Bogor Weather by Month
Pick a month to see the average temperature, rainfall and sunshine in Bogor - and find the best time to visit.
Bogor 3-Day Forecast
Temperature Rainfall Sunshine Humidity
See the full Bogor climate overview or explore weather in Indonesia.
Popular this month
Where to go in July - average daytime high across popular destinations.
Bucket list
Need travel inspiration? Check out our bucket list articles and be inspired.
 10 Hidden gems in Asia you need to visit
Explore 10 hidden gems in Asia offering authentic experiences, from pristine beaches and remote islands to cultural treks and peaceful mountain villages.
The ultimate guide to Ubud – everything you need to know to escape the crowds
There is a way to experience Ubud in a fantastic less crowded way and this article will be your guide how to do that. Find the best places to stay, where to eat and much more.
Top 5 hidden gem islands in Indonesia
Discover Indonesia's secret islands: pristine beaches, rich history, and vibrant culture await beyond Bali and Java. Dive into untouched paradise.
Six Organic Farms & Farmstays in Indonesia
We've compiled a list of organic farms in Indonesia that have a positive impact on their communities - they could use your help during this pandemic.