Coron Monthly Rainfall & Precipitation
This page shows both the average monthly rainfall and the number of rainy days in Coron, Busuanga Island, Philippines. The numbers reflect climate data gathered over a 30-year period, from 1990 to 2020. Now, let's explore all the details to give you a full picture.
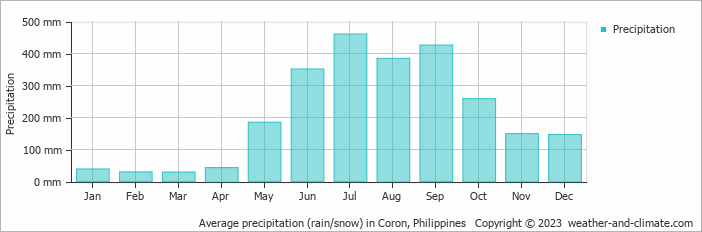
Coron experiences significant rainfall throughout the year, averaging 2499 mm (98 in) of precipitation annually. However, this abundant rainfall is not evenly distributed, with a distinct dry and rainy season during certain months. You can clearly see this in our monthly precipitation graphs below.
Monthly Rainfall & Rainy Days
Monthly Precipitation Levels
The average number of days each month with precipitation (> 0.2 mm (0.01 in))
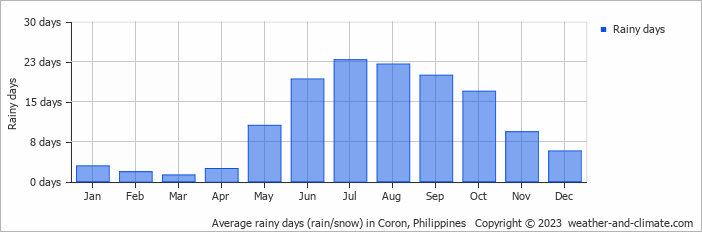
Coron can be quite wet during July, receiving approximately 461 mm (18 in) of precipitation over 23 rainy days.
In contrast March, experiences much drier conditions, with 29 mm (1.1 in) of rainfall, spread across a single rainy day.
July, the wettest month, has a maximum daytime temperature of 30°C (86°F). During the driest month March you can expect a temperature of 29°C (84°F). For more detailed insights into the city's temperatures, visit our Coron Temperature page.
Explore Coron's Historical Precipitation: 1976-2026
Browse day-by-day precipitation records for Coron spanning 51 years. Select any month and year to see actual rainfall and snowfall recorded on each day.
Annual Rainfall in Philippines: City Comparison
The map below shows the annual precipitation across Philippines. You can also select the different months in case you are interested in a specific month.
Coron vs World: Rainfall Compared
Coron's average annual precipitation is 2499 mm (98 in). Let's compare this to some popular worldwide tourist destinations:
Athens, Greece, receives an average annual precipitation of 400 mm (16 in), making it one of the drier Mediterranean climates with rainfall mostly in winter.
Beijing, China, receives 560 mm (22 in) of annual precipitation, concentrated in the summer months.
Melbourne, Australia, has 690 mm (27 in) of rainfall annually, spread fairly evenly throughout the year.
Kuala Lumpur, Malaysia, receives 2529 mm (100 in) of annual rainfall, characteristic of its equatorial tropical rainforest climate, with consistent rainfall throughout the year and peak months during March and November.
Precipitation amounts are measured using specific gauges installed at weather stations, collecting both rain and snow and any other type of precipitation. Rainfall is measured directly in millimeters, while that from snow and ice is obtained by melting it. Automated systems often incorporate heaters to make this easier.
Information from these stations is transmitted via Wi-Fi, satellite, GPS, or telephone connections to central monitoring networks. This information is immediately updated and integrated into weather models and forecasts.
Precipitation has a very strong role in determining the local climate and ecosystem:
- Changing Rainfall Patterns: Global warming causes drastic changes in the patterns of rainfall. Some areas have been experiencing increased frequency and intensity of rainfall, while other areas experience longer dry spells or even droughts.
- Local Impacts: Many regions are experiencing heavier rainfall in the winter months and drier, hotter summers. This affects agriculture, water resources, and ecosystems.
- The U.S. has a significant number of thunderstorms every year, with over 14.6 million taking place across the world annually.
- Approximately 70% of lightning bolts strike land rather than oceans.
- A storm named John was the longest-lasting Pacific tropical storm, continuing for 31 days. As it crossed the dateline twice, it changed status from a hurricane to a typhoon and back to a hurricane.
For more detailed information about Coron's weather, including sunshine hours, humidity levels, and temperature data, visit our Coron Climate page.
Coron Weather by Month
Pick a month to see the average temperature, rainfall and sunshine in Coron - and find the best time to visit.
Coron 3-Day Forecast
Temperature Rainfall Humidity Wind Speed Water Temp
See the full Coron climate overview or explore weather in Philippines.
Popular this month
Where to go in July - average daytime high across popular destinations.
Bucket list
Need travel inspiration? Check out our bucket list articles and be inspired.
 Stay at a 100% self-sustaining island resort
Coron was one of our favorite destinations in the world. The beauty of this island combined with the amazing hospitality and smiles of the Filipinos is a golden combination.
The 10 Most Exquisite Beaches in the Philippines
Explore the top 10 breathtaking beaches in the Philippines, from serene Nacpan Beach to volcanic Camiguin Island, in our detailed guide.
Siquijor island, the island of magic, fireflies, small breathtaking bays and so much more
All the islands of the Philippines are beautiful, however Siquijor island stands out. It is the island of magic, fireflies, small breathtaking bays and so much more.
Stay at a 100% self-sustaining island resort
Coron was one of our favorite destinations in the world. The beauty of this island combined with the amazing hospitality and smiles of the Filipinos is a golden combination.