Horsham Monthly Rainfall & Precipitation
This page shows both the average monthly rainfall and the number of rainy days in Horsham, West Sussex, United Kingdom. This average is based on long-term data collected between 1990 and 2020. Now, let's break down all the details for a clearer picture.
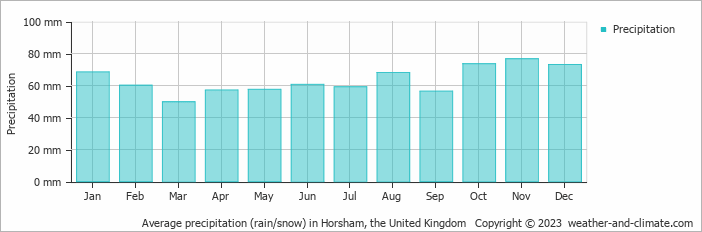
On average, Horsham receives a reasonable amount of rain/snowfall, with an annual precipitation of 760 mm (30 in).
Monthly Precipitation Levels
The average number of days each month with precipitation (> 0.2 mm (0.01 in))
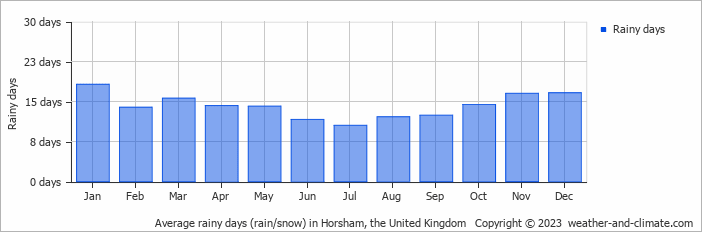
Precipitation levels in Horsham remain relatively steady throughout the year. November has the most rain, with 77 mm (3 in) over 17 days. In March, this drops slightly to 50 mm (2 in), making the city's climate fairly predictable.
November, the wettest month, has a maximum daytime temperature of 12°C (54°F). During the driest month March you can expect a temperature of 12°C (54°F). For more detailed insights into the city's temperatures, visit our Horsham Temperature page.
Annual Rainfall in the United Kingdom: City Comparison
The map below shows the annual precipitation across the United Kingdom. You can also select the different months in case you are interested in a specific month.
 heavy rainfall
 high
high
 moderate
 low
low
 almost none
Horsham vs World: Rainfall Compared
Horsham's average annual precipitation is 760 mm (30 in). Let's compare this to some popular worldwide tourist destinations:
In Barcelona, Spain, the average annual precipitation is 644 mm (25 in), evenly distributed across the year with no extreme wet or dry seasons.
In Shanghai, China, the annual average precipitation is 1347 mm (53 in), with a humid subtropical climate.
In Tokyo, Japan, the average annual precipitation is 1528 mm (60 in), with significant summer rains due to typhoon season.
Bangkok, Thailand, experiences a tropical monsoon climate with 1668 mm (66 in) of annual rainfall, with the heaviest precipitation occurring during September and October.
Precipitation amounts are measured using specific gauges installed at weather stations, collecting both rain and snow and any other type of precipitation. Rainfall is measured directly in millimeters, while that from snow and ice is obtained by melting it. Automated systems often incorporate heaters to make this easier.
Information from these stations is transmitted via Wi-Fi, satellite, GPS, or telephone connections to central monitoring networks. This information is immediately updated and integrated into weather models and forecasts.
Tropical Rainforests: In tropical regions, rainfall is generally abundant year-round. Areas near the equator, like the Amazon rainforest, can receive up to 3000 mm (118 in) of rain annually.
Desert Regions: Deserts such as the Sahara and Arabian deserts typically see less than 250 mm (9.8 in) of rainfall annually. Rainfall tends to be infrequent, but when it does occur, it is often intense.
Temperate Zones: In temperate regions, precipitation tends to be more evenly distributed, though areas closer to the ocean may see more rain in the winter months, and areas further inland experience drier summers.
Polar Regions: Precipitation in polar regions, like Antarctica, is extremely low, often falling as snow. Average annual precipitation in Antarctica is less than 200 mm (7.9 in), with some areas receiving as little as 50 mm (2 in) annually.
- "Ginger" was the longest-lasting Atlantic tropical storm, which spun around the open ocean for 28 days in 1971.
- The world's largest snowflake was recorded in the Guinness Book of Records, at 38 cm (15 inches) wide and 20 cm (7.9 inches) thick. The snowflake fell at Fort Keogh, Montana, USA, on 28 January 1887.
- The greatest snowfall recorded was on Mt. Rainier, Washington State, USA—over 31.5 meters (103 feet) fell during the winter of 1972.
For more detailed information about Horsham's weather, including sunshine hours, humidity levels, and temperature data, visit our Horsham Climate page.