New York City (NY) Temperatures: Monthly Averages and Year-Round Insights
On this page, we’ll explore New York City’s temperature statistics in detail, including day and night variations and monthly averages. We’ll also compare the annual temperature to other cities in the United States of America.
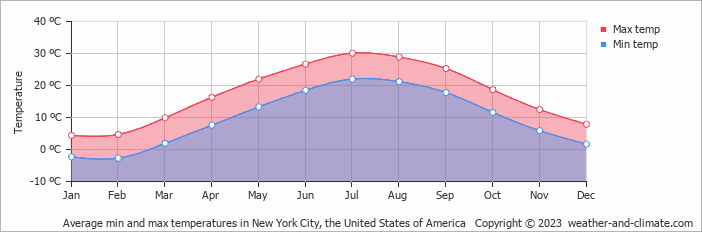
Monthly Temperature Averages
The climate in New York City is known for significant temperature differences throughout the year. On average, maximum daytime temperatures range from a very warm 30°C in July to a cold 4°C in February. Nighttime temperatures can drop, with averages reaching -3°C in February.
The chart below illustrates the average maximum day and minimum night temperatures in New York City by month:
The minimum temperature is commonly observed between 4 AM and 6 AM, with the maximum occurring around 3 PM, when the sun’s strength is at its peak. July, the city’s warmest month, sees 271 hours of sunshine.
The chart below shows the average temperature throughout the year:
February, the city’s coldest month, sees about 84 mm of rainfall spread over roughly 10 days. It records 162 hours of sunshine of sunshine.
Annual Temperatures in the United States of America Compared
The map below shows the annual temperature across the United States of America. You can also select the different months in case you are interested in a specific month.
 very warm
 warm
warm
 pleasant
 moderate
 cold
cold
 very cold
New York City Temperatures Compared World Wide
New York City’s average annual maximum temperature is 17°C. Let’s compare this with some popular tourist destinations:
Athens, Greece, experiences an average annual temperature of 23°C, with hot summers and mild winters typical of a Mediterranean climate.
Interlaken, Switzerland, the average annual temperature is significantly lower at 8°C, with mild summers and very cold winters.
In Shanghai, China, the annual average temperature is 21°C, offering warm summers and mild winters.
In Brisbane, Australia, the average annual temperature is 26°C, making it warmer than Sydney.
How does the temperature feel?
Humidity is an essential factor in how you experience temperature. When a warm period is accompanied by high humidity, it results in a higher perceived temperature. This is especially true when temperatures exceed 25°C, as it can cause greater discomfort.
On the other hand, in cooler months, especially when temperatures dip below 10°C, high humidity can intensify the cold. This makes the air feel much colder than it really is.
In New York City, during the coolest month, February, you will experience 59% humidity, which is considered moderate. This is accompanied by an average maximum temperature of 5°C. In the warmest month, July, the humidity is 64% combined with an average maximum temperature of 30°C, which creates a high-feel temperature. Explore our detailed page on humidity levels for further details.
How are these Temperatures Measured?
Generally, temperature data depicting climate is usually given over a 30-year average in order to reduce short-term fluctuations and reveal better long-term trends in climate conditions.
This temperature data is taken from land-based thermometers, ocean buoys, ships, and satellites. These measurements are transmitted to weather stations and climate centers around the globe where they are processed, averaged, and analyzed in order to monitor the trends and create climate models.
Sea vs. Land Temperatures
The influence of nearby oceans or large water bodies significantly affects local temperatures:
- Ocean Influence: Coastal regions tend to have more stable temperatures, as large bodies of water absorb and release heat slowly. This often results in milder winters and cooler summers compared to inland areas.
- Continental Climates: Landmasses well away from large bodies of water tend to show greater extremes in temperature, having hotter summers and colder winters because of the absence of water as a moderating influence.
For more detailed information about New York City’s weather, including monthly rainfall, sunshine hours, and humidity levels, visit our New York City climate page.
Current temperature in New York City (NY)
 8 m/s
8 m/salmost clear and no rain
5 m/sovercast and snow
10 m/sbroken clouds and no rain