Zandvoort Temperature by Month
The average annual maximum temperature in Zandvoort, Noord-Holland, Netherlands is 14°C (57°F), with daytime highs ranging from 7°C (45°F) in January to 21°C (70°F) in August. This page covers monthly averages, day-night differences, and how Zandvoort compares to cities worldwide.
Zandvoort Monthly Temperatures
The climate in Zandvoort is dynamic, ranging widely from chilly in winter to pleasant in summer. Nights are significantly colder, with lows dropping from 16°C (61°F) in August to 3°C (37°F) in January.
The chart below illustrates the average maximum day and minimum night temperatures in Zandvoort by month:
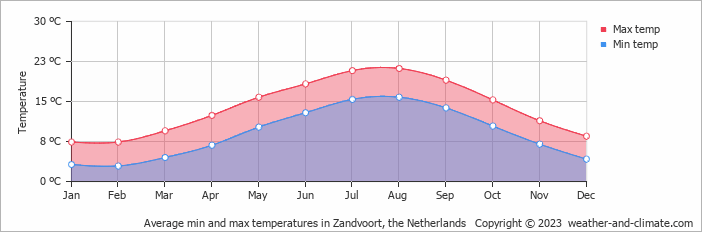
The minimum temperature is often recorded between 4 AM and 6 AM, while the highest temperature is usually reached at 3 PM, when the sun's heating effect is strongest.
The chart below shows the average temperature throughout the year:
Daily Historical Temperatures
Average high and low temperatures for each day of the month based on long-term records. 50-year average (1976-2025)
Average temperatures in July
Historical Zandvoort Temperatures: 1976-2026
Browse day-by-day temperature records for Zandvoort spanning 51 years. Select any month and year to see actual high and low temperatures recorded on each day.
Temperature: Zandvoort vs the Netherlands
The map below shows the annual temperature across the Netherlands. You can also select individual months if you want to compare a specific time of year.
Zandvoort vs World: Temperature Compared
Zandvoort's average annual maximum temperature is 14°C (57°F). To put that in context, here's how it compares to a few well-known destinations:
Rome, Italy averages 20°C (68°F) annually, with reliably warm summers and comfortable winters.
Glasgow, Scotland averages 13°C (55°F) a year, mild but often grey, with cold winters and rarely hot summers.
Chicago, USA averages 15°C (59°F) annually, known for extreme seasonal swings, from bitterly cold winters to warm summers.
Tokyo, Japan averages 21°C (70°F) a year, with hot summers, cool winters, and a well-defined cherry blossom spring.
Climate temperature data is typically calculated as a 30-year average. This smooths out year-to-year variability and gives a more reliable picture of what a place is actually like, rather than what happened in any single unusual year.
The readings come from a range of sources, land-based weather stations, ocean buoys, ships, and satellites. That data is collected by weather services around the world, then pooled, quality-checked, and averaged to produce the climate records you see here.
Whether a city sits on the coast or deep inland makes a significant difference to its climate. Coastal areas tend to have more stable temperatures year-round, large bodies of water absorb heat slowly in summer and release it gradually in winter, keeping extremes in check. Cities far from the sea don't benefit from that buffer, which is why continental climates tend to have hotter summers and colder winters than their coastal counterparts at the same latitude.
For more on Zandvoort's weather, including monthly rainfall, sunshine hours, and humidity, visit our Zandvoort climate page.
Zandvoort Weather by Month
Pick a month to see the average temperature, rainfall and sunshine in Zandvoort - and find the best time to visit.
Zandvoort 3-Day Forecast
Temperature Rainfall Water Temp
See the full Zandvoort climate overview or explore weather in the Netherlands.
Popular this month
Where to go in July - average daytime high across popular destinations.
Bucket list
Need travel inspiration? Check out our bucket list articles and be inspired.
 Flower fields in the Netherlands
The flower fields in The Netherlands are world famous. The red, pink and yellow colors are breathtakingly beautiful and should be on the bucket list.
Pride in Amsterdam
Nowhere in the world is Pride being celebrated on the water on such a scale as in Amsterdam. It is an unique experience that every person needs to add to his, her or its bucket list.
The greenest experience of Amsterdam
If you’re looking for an experience of Amsterdam that is rooted in nature, that can help you go outside and get your hands dirty, then these tips are for you.
Amsterdam Dance Event
ADE is one of the larger festival giants, but you may never have heard of it if you are not an electronic music fan. It last five days and takes place in October.