Yénion Temperature by Month
Yénion, Ionian Islands, Greece has an average annual maximum temperature of 20°C (68°F), ranging from 14°C (57°F) in January to 27°C (81°F) in August. Below you'll find a full monthly breakdown and a comparison with cities worldwide.
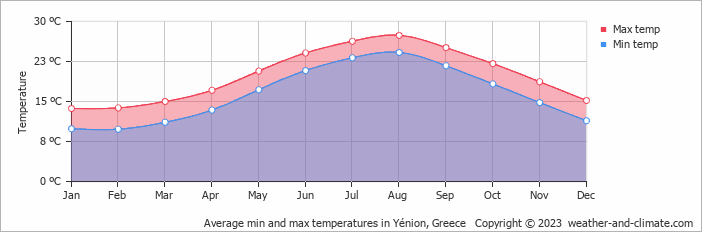
Yénion Monthly Temperatures
With significant temperature fluctuations, Yénion enjoys distinct seasons year-round. Nighttime lows range from 24°C (75°F) in August to 10°C (50°F) in January.
The chart below illustrates the average maximum day and minimum night temperatures in Yénion by month:
Daily lows are most common between 4 AM and 6 AM. By 3 PM temperatures reach their daily high, driven by peak solar heating.
The chart below shows the average temperature throughout the year:
Temperature: Yénion vs Greece
The map below shows the annual temperature across Greece. You can also select individual months if you want to compare a specific time of year.
Yénion vs World: Temperature Compared
Yénion's average annual maximum temperature is 20°C (68°F). To put that in context, here's how it compares to a few well-known destinations:
Barcelona, Spain has an annual average of around 21°C (70°F), with warm summers and mild, fairly short winters.
Reykjavík, Iceland averages 9°C (48°F) a year, mild summers by Icelandic standards, but cold winters and frequent wind.
Buenos Aires, Argentina averages 23°C (73°F) a year, with hot summers and mild winters, and seasons reversed compared to Europe.
Tokyo, Japan averages 21°C (70°F) a year, with hot summers, cool winters, and a well-defined cherry blossom spring.
Climate temperature data is typically calculated as a 30-year average. This smooths out year-to-year variability and gives a more reliable picture of what a place is actually like, rather than what happened in any single unusual year.
The readings come from a range of sources, land-based weather stations, ocean buoys, ships, and satellites. That data is collected by weather services around the world, then pooled, quality-checked, and averaged to produce the climate records you see here.
Whether a city sits on the coast or deep inland makes a significant difference to its climate. Coastal areas tend to have more stable temperatures year-round, large bodies of water absorb heat slowly in summer and release it gradually in winter, keeping extremes in check. Cities far from the sea don't benefit from that buffer, which is why continental climates tend to have hotter summers and colder winters than their coastal counterparts at the same latitude.
For more on Yénion's weather, including monthly rainfall, sunshine hours, and humidity, visit our Yénion climate page.
Yénion Weather by Month
Pick a month to see the average temperature, rainfall and sunshine in Yénion - and find the best time to visit.
Yénion 3-Day Forecast
Temperature Rainfall
See the full Yénion climate overview or explore weather in Greece.
Popular this month
Where to go in July - average daytime high across popular destinations.
Bucket list
Need travel inspiration? Check out our bucket list articles and be inspired.
 Top 5 secluded beaches in Greece
Explore Greece's hidden gems: secluded beaches like Fokos, Seychelles, Potami, Kedrodasos, and Mouros for tranquil adventures away from crowds.
Discover Zakynthos
On the Greek island you can discover the rugged coastline, authentic old villages, a beautiful interior and the caves with the beautiful azure water.
Why Santorini should be on every Bucket List
This Greek island is home to some of the most stunning scenery globally, with its beautiful Caldera views, white-washed houses and crystal-clear waters.