















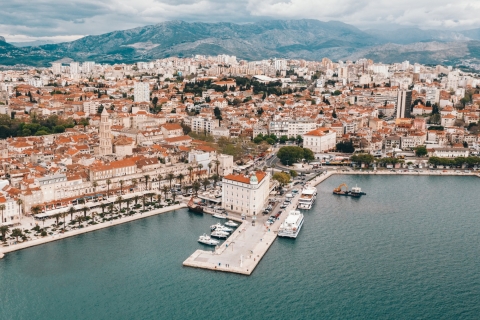
 Magical Split
The best travel time to Split in Croatia is from May til October and the best months are May, June and September.
Veruda in Croatia sees significant seasonal temperature differences, with daytime highs between 10°C (50°F) in January and 27°C (81°F) in August, averaging 18°C (64°F) annually. Explore the full monthly breakdown below.
In Veruda, temperatures differ significantly between summer and winter months. Nighttime lows reflect this range, dropping from 23°C (73°F) in August to 6°C (43°F) in January.
The chart below illustrates the average maximum day and minimum night temperatures in Veruda by month:
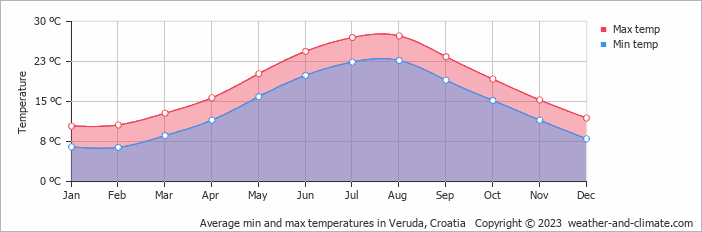
The coldest point of the day usually falls between 4 AM and 6 AM, with temperatures peaking around 3 PM. August, the city's warmest month, gets 270 hours of sunshine.
The chart below shows the average temperature throughout the year:
The map below shows the annual temperature across Croatia. You can also select individual months if you want to compare a specific time of year.
Veruda's average annual maximum temperature is 18°C (64°F). To put that in context, here's how it compares to a few well-known destinations:
Lisbon, Portugal averages 21°C (70°F) annually, warm summers, mild winters, and rain mainly in the cooler months.
Glasgow, Scotland averages 13°C (55°F) a year, mild but often grey, with cold winters and rarely hot summers.
Boston, USA averages 16°C (61°F) annually, with four distinct seasons and cold winters that rival northern Europe.
Brisbane, Australia averages 26°C (79°F) a year, with warm winters and hot, humid summers.
Climate temperature data is typically calculated as a 30-year average. This smooths out year-to-year variability and gives a more reliable picture of what a place is actually like, rather than what happened in any single unusual year.
The readings come from a range of sources, land-based weather stations, ocean buoys, ships, and satellites. That data is collected by weather services around the world, then pooled, quality-checked, and averaged to produce the climate records you see here.
For cities and regions with significant elevation, altitude is one of the biggest factors shaping local temperatures. As a rule of thumb, temperatures fall by around 6°C for every 1,000 metres gained, so a city at 2,000 metres will typically be around 12°C cooler than a city at sea level in the same region. Higher ground also tends to see more dramatic day-to-night temperature swings, since thinner air loses heat faster after sunset.
For more on Veruda's weather, including monthly rainfall, sunshine hours, and humidity, visit our Veruda climate page.
Pick a month to see the average temperature, rainfall and sunshine in Veruda - and find the best time to visit.
Temperature Rainfall Sunshine Water Temp
See the full Veruda climate overview or explore weather in Croatia.
Where to go in October - average daytime high across popular destinations.
Trogir 20°C (68°F) Zadar
 21°C (70°F) Makarska
 20°C (68°F) Poreč19°C (66°F) Rovinj19°C (66°F) Pula19°C (66°F) Split20°C (68°F) Dubrovnik20°C (68°F)
 Need travel inspiration? Check out our bucket list articles and be inspired.
Magical Split
The best travel time to Split in Croatia is from May til October and the best months are May, June and September.
 Sail the crystal-clear waters of Croatia and enjoy its stunning coastline
Croatia is an idyllic sailing destination, boasting 1,777 miles (2,860 km) of beautiful beaches and pristine waters. With over 1,000 Islands dotting the Adriatic Sea, there's a perfect spot for everyone.

 Cycle the Danube trail
The Danube cycle route is one of the most popular cycling routes in Europe, and rightly so, because it is a varied route that is interesting both in terms of culture and nature.

 The 10 most charming villages in France
Discover France's top 10 beautiful villages. From Normandy to the Côte d'Azur, experience quaint squares and cobbled streets. Which one will you visit this summer?