Utrecht Temperature by Month
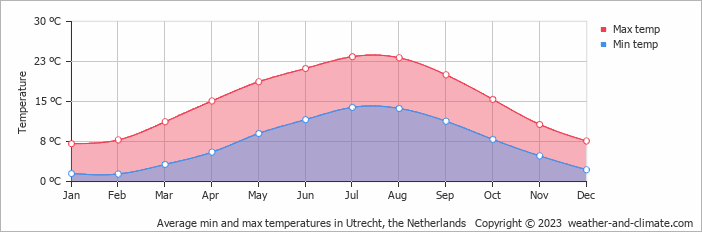
Utrecht, Utrecht Province, Netherlands has an average annual maximum temperature of 15°C (59°F), ranging from 7°C (45°F) in January to 23°C (73°F) in July. Below you'll find a full monthly breakdown and a comparison with cities worldwide.
Utrecht Monthly Temperatures
With significant temperature fluctuations, Utrecht enjoys distinct seasons year-round. Nighttime lows range from 14°C (57°F) in July to 1°C (34°F) in January.
The chart below illustrates the average maximum day and minimum night temperatures in Utrecht by month:
From around 4 AM to 6 AM temperatures are at their lowest; by 3 PM they've climbed to their daily peak. July, the warmest month, averages 215 hours of sunshine.
The chart below shows the average temperature throughout the year:
Daily Historical Temperatures
Average high and low temperatures for each day of the month based on long-term records. 50-year average (1976-2025)
Average temperatures in July
Historical Utrecht Temperatures: 1976-2026
Browse day-by-day temperature records for Utrecht spanning 51 years. Select any month and year to see actual high and low temperatures recorded on each day.
Temperature: Utrecht vs the Netherlands
The map below shows the annual temperature across the Netherlands. You can also select individual months if you want to compare a specific time of year.
Utrecht vs World: Temperature Compared
Utrecht's average annual maximum temperature is 15°C (59°F). To put that in context, here's how it compares to a few well-known destinations:
Rome, Italy averages 20°C (68°F) annually, with reliably warm summers and comfortable winters.
Reykjavík, Iceland averages 9°C (48°F) a year, mild summers by Icelandic standards, but cold winters and frequent wind.
Shanghai, China averages 21°C (70°F) a year, with warm summers, mild winters, and a noticeable spring and autumn.
Perth, Australia averages 25°C (77°F) annually, with a classic Mediterranean climate, hot dry summers and mild wet winters.
What Does the Temperature Feel Like in Utrecht?
Temperature alone doesn't tell the whole story, humidity plays a big role in how warm or cold it actually feels. High humidity in summer makes the heat feel more intense, particularly once temperatures climb above 25°C. In winter, the same humidity can make cold air feel sharper than the thermometer suggests.
In the cooler months, when temperatures drop below 10°C, high humidity makes the cold feel more cutting than it would in dry conditions.
In Utrecht, January is the coolest month, with average highs of 7°C (45°F) and humidity around 87%, considered very high. In July, the warmest month, temperatures average 23°C (73°F) with 77% humidity, conditions that feel high. For a full picture, see our humidity page.
Climate temperature data is typically calculated as a 30-year average. This smooths out year-to-year variability and gives a more reliable picture of what a place is actually like, rather than what happened in any single unusual year.
The readings come from a range of sources, land-based weather stations, ocean buoys, ships, and satellites. That data is collected by weather services around the world, then pooled, quality-checked, and averaged to produce the climate records you see here.
Global average temperatures have risen by around 1.2°C since the pre-industrial era, and the effects are visible across many regions. Winters are milder on average, with fewer frost days and less snow in many parts of the world. Heatwaves are more frequent and more intense, and Europe's summers of 2018, 2019, and 2020 all set records.
Summers are also getting drier in some areas, while winter rainfall has increased in others. This contributies to higher river levels and more flooding. In many countries, spring arrives earlier and autumn lasts longer. It has knock-on effects for wildlife, agriculture, and local ecosystems.
For more on Utrecht's weather, including monthly rainfall, sunshine hours, and humidity, visit our Utrecht climate page.
Utrecht Weather by Month
Pick a month to see the average temperature, rainfall and sunshine in Utrecht - and find the best time to visit.
Utrecht 3-Day Forecast
Temperature Rainfall Sunshine Humidity Wind Speed
See the full Utrecht climate overview or explore weather in the Netherlands.
Popular this month
Where to go in July - average daytime high across popular destinations.
Bucket list
Need travel inspiration? Check out our bucket list articles and be inspired.
 Flower fields in the Netherlands
The flower fields in The Netherlands are world famous. The red, pink and yellow colors are breathtakingly beautiful and should be on the bucket list.
Pride in Amsterdam
Nowhere in the world is Pride being celebrated on the water on such a scale as in Amsterdam. It is an unique experience that every person needs to add to his, her or its bucket list.
The greenest experience of Amsterdam
If you’re looking for an experience of Amsterdam that is rooted in nature, that can help you go outside and get your hands dirty, then these tips are for you.
Amsterdam Dance Event
ADE is one of the larger festival giants, but you may never have heard of it if you are not an electronic music fan. It last five days and takes place in October.