San Pietro in Campiano Temperature by Month
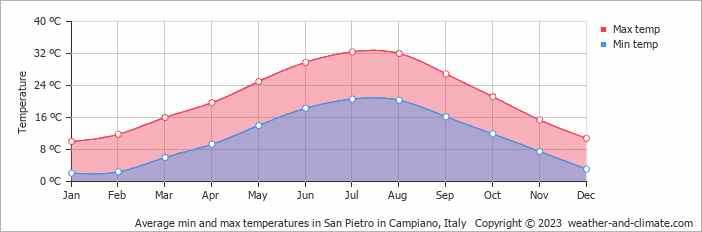
The average annual maximum temperature in San Pietro in Campiano, Emilia-Romagna, Italy is 21°C (70°F), with daytime highs ranging from 10°C (50°F) in January to 32°C (90°F) in July. This page covers monthly averages, day-night differences, and how San Pietro in Campiano compares to cities worldwide.
San Pietro in Campiano Monthly Temperatures
Visitors to San Pietro in Campiano will encounter a climate influenced by big temperature differences across the year. Nighttime temperatures range from 21°C (70°F) in July to 2°C (36°F) in January.
The chart below illustrates the average maximum day and minimum night temperatures in San Pietro in Campiano by month:
The coolest part of the day is typically between 4 AM and 6 AM, while 3 PM is usually the warmest, when solar heating is at its peak. July, the city's warmest month, averages 298 hours of sunshine.
The chart below shows the average temperature throughout the year:
Temperature: San Pietro in Campiano vs Italy
The map below shows the annual temperature across Italy. You can also select individual months if you want to compare a specific time of year.
 very warm
 warm
warm
 pleasant
 moderate
 cold
cold
 very cold
San Pietro in Campiano vs World: Temperature Compared
San Pietro in Campiano's average annual maximum temperature is 21°C (70°F). To put that in context, here's how it compares to a few well-known destinations:
Rome, Italy averages 20°C (68°F) annually, with reliably warm summers and comfortable winters.
Interlaken, Switzerland averages 8°C (46°F) a year, with cold winters and cool summers thanks to its Alpine setting.
Osaka, Japan averages 22°C (72°F) annually, with hot humid summers, mild winters, and pleasant spring and autumn seasons.
Adelaide, Australia averages 21°C (70°F) a year, with warm summers, mild winters, and relatively low rainfall year-round.
What Does the Temperature Feel Like in San Pietro in Campiano?
Temperature alone doesn't tell the whole story — humidity plays a big role in how warm or cold it actually feels. High humidity in summer makes the heat feel more intense, particularly once temperatures climb above 25°C. In winter, the same humidity can make cold air feel sharper than the thermometer suggests.
In the cooler months, when temperatures drop below 10°C, high humidity makes the cold feel more cutting than it would in dry conditions.
In San Pietro in Campiano, January is the coolest month, with average highs of 10°C (50°F) and humidity around 83% — considered very high. In July, the warmest month, temperatures average 32°C (90°F) with 72% humidity — conditions that feel high. For a full picture, see our humidity page.
Climate temperature data is typically calculated as a 30-year average. This smooths out year-to-year variability and gives a more reliable picture of what a place is actually like, rather than what happened in any single unusual year.
The readings come from a range of sources — land-based weather stations, ocean buoys, ships, and satellites. That data is collected by weather services around the world, then pooled, quality-checked, and averaged to produce the climate records you see here.
Seasonal temperature shifts influence more than just how warm it feels — they also drive changes in rainfall, cloud cover, and wind patterns throughout the year.
Warmer air holds more moisture, which tends to mean heavier or more frequent rain during the warmer months. When temperatures drop in winter, any precipitation that does fall is more likely to come as snow or sleet, though in San Pietro in Campiano this rarely lasts long on the ground.
For more on San Pietro in Campiano's weather — including monthly rainfall, sunshine hours, and humidity — visit our San Pietro in Campiano climate page.


