Biliran Temperature by Month
Biliran in Visayas, Philippines enjoys a stable climate, with daytime temperatures staying close to 29°C (84°F) throughout the year. Explore the full monthly breakdown below.
Biliran Monthly Temperatures
The temperature in Biliran changes very little across the seasons, maintaining a similar climate throughout the year. Maximum daytime temperatures range from a comfortable 28°C (82°F) in January to a very warm 30°C (86°F) in May. Nighttime lows range from 27°C (81°F) in May to 25°C (77°F) in January.
The chart below illustrates the average maximum day and minimum night temperatures in Biliran by month:
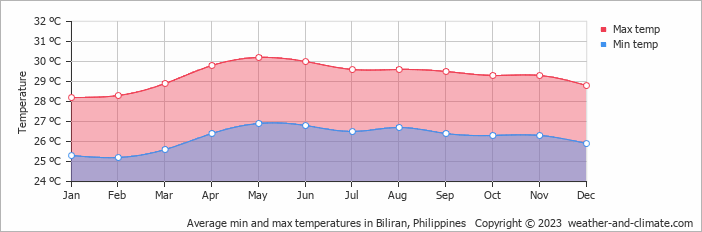
Low temperatures are most often recorded between 4 AM and 6 AM, while highs typically occur around 3 PM.
The chart below shows the average temperature throughout the year:
Temperature: Biliran vs Philippines
The map below shows the annual temperature across Philippines. You can also select individual months if you want to compare a specific time of year.
Biliran vs World: Temperature Compared
Biliran's average annual maximum temperature is 29°C (84°F). To put that in context, here's how it compares to a few well-known destinations:
Lisbon, Portugal averages 21°C (70°F) annually, warm summers, mild winters, and rain mainly in the cooler months.
Toronto, Canada averages 13°C (55°F) annually, with cold snowy winters balanced by genuinely warm summers.
Chicago, USA averages 15°C (59°F) annually, known for extreme seasonal swings, from bitterly cold winters to warm summers.
Tokyo, Japan averages 21°C (70°F) a year, with hot summers, cool winters, and a well-defined cherry blossom spring.
What Does the Temperature Feel Like in Biliran?
Temperature alone doesn't tell the whole story, humidity plays a big role in how warm or cold it actually feels. High humidity in summer makes the heat feel more intense, particularly once temperatures climb above 25°C. In winter, the same humidity can make cold air feel sharper than the thermometer suggests.
In Biliran, January is the coolest month, with average highs of 28°C (82°F) and humidity around 86%, considered very high. In May, the warmest month, temperatures average 30°C (86°F) with 82% humidity, conditions that feel very high. For a full picture, see our humidity page.
Climate temperature data is typically calculated as a 30-year average. This smooths out year-to-year variability and gives a more reliable picture of what a place is actually like, rather than what happened in any single unusual year.
The readings come from a range of sources, land-based weather stations, ocean buoys, ships, and satellites. That data is collected by weather services around the world, then pooled, quality-checked, and averaged to produce the climate records you see here.
Whether a city sits on the coast or deep inland makes a significant difference to its climate. Coastal areas tend to have more stable temperatures year-round, large bodies of water absorb heat slowly in summer and release it gradually in winter, keeping extremes in check. Cities far from the sea don't benefit from that buffer, which is why continental climates tend to have hotter summers and colder winters than their coastal counterparts at the same latitude.
For more on Biliran's weather, including monthly rainfall, sunshine hours, and humidity, visit our Biliran climate page.
Biliran Weather by Month
Pick a month to see the average temperature, rainfall and sunshine in Biliran - and find the best time to visit.
Biliran 3-Day Forecast
See the full Biliran climate overview or explore weather in Philippines.
Popular this month
Where to go in July - average daytime high across popular destinations.
Bucket list
Need travel inspiration? Check out our bucket list articles and be inspired.
 10 Hidden gems in Asia you need to visit
Explore 10 hidden gems in Asia offering authentic experiences, from pristine beaches and remote islands to cultural treks and peaceful mountain villages.
 The 10 Most Exquisite Beaches in the Philippines
Explore the top 10 breathtaking beaches in the Philippines, from serene Nacpan Beach to volcanic Camiguin Island, in our detailed guide.
Siquijor island, the island of magic, fireflies, small breathtaking bays and so much more
All the islands of the Philippines are beautiful, however Siquijor island stands out. It is the island of magic, fireflies, small breathtaking bays and so much more.
Stay at a 100% self-sustaining island resort
Coron was one of our favorite destinations in the world. The beauty of this island combined with the amazing hospitality and smiles of the Filipinos is a golden combination.