Villalón de Campos Sunshine Hours by Month
To truly understand a climate, we must look at its sunshine. This page shows the total number of hours of direct sunlight per month and the average hours per day in Villalón de Campos, Castile and Leon, Spain. This average is based on long-term data collected between 1990 and 2020.
Monthly hours of sunshine
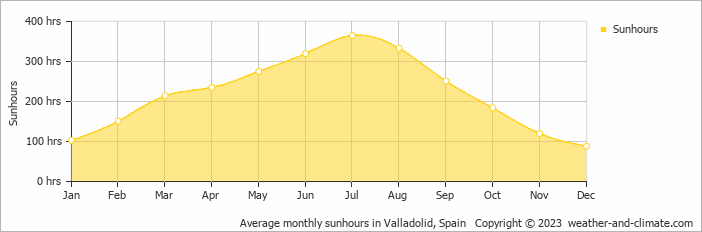
Those who love seasonal contrasts will appreciate Villalón de Campos. Expect long, bright days with 365 hours in July and darker periods with just 88 hours in December. The total annual amount of sun is 2639 hours.
Daily hours of sunshine
This means the city can be enjoyed more throughout the sunniest month of July under a blue sky, with approximately 12.2 hours of sunshine daily. In contrast, the city experiences much darker days in December, with only 2.9 hours of sunlight per day.
Villalón de Campos vs Major Cities: Sunshine Compared
Villalón de Campos enjoys an average of 2639 hours of sunshine annually. Let’s compare this with some popular tourist destinations:
In Barcelona, Spain, there are 2530 hours of sunshine annually and is a city that can be visited year-round.
In contrast, Juneau, Alaska, receives only about 1523 hours of sunshine per year and is known for its very short days in winter and frequently overcast conditions.
Meanwhile, Buenos Aires, Argentina, enjoys a humid subtropical climate with 2520 hours of sunshine annually.
In Brisbane, Australia, the annual sunshine averages 2999 hours, making it one of Australia’s sunniest cities.
Related Climate Data for Villalón de Campos
October, Villalón de Campos’s wettest month, receives 21 mm (0.8 in) of rainfall and has a maximum daytime temperature of 19°C (66°F). During the driest month August you can expect a temperature of 30°C (86°F).
For more detailed insights into the city’s temperatures, check out our Temperature page. To explore more about precipitation patterns, visit our Villalón de Campos Precipitation page.
Villalón de Campos Weather by Month
Pick a month to see the average temperature, rainfall and sunshine in Villalón de Campos - and find the best time to visit.




Villalón de Campos 3-Day Forecast
Temperature Rainfall Sunshine Humidity
See the full Villalón de Campos climate overview or explore weather in Spain.
Popular this month
Where to go in September - average daytime high across popular destinations.















Bucket list
Need travel inspiration? Check out our bucket list articles and be inspired.
 El Hierro: The smallest Canary island without mass tourism
Mainly nature lovers and those seeking tranquility go to El Hierro. The island is know for its beautiful mountains and you can wonder around for days here.
Spain in October: Where Is It Warmest and Sunniest?
Discover where Spain is warmest in October, with climate comparisons for Seville, Alicante, Málaga, Tenerife, Madrid and Barcelona.
Visit national Park El Teide
This national park is truly a unique place that you should not miss. You will find landscapes that seem to come from another plane and you will feel tiny in these impressive surroundings.
Sevilla: A Blend of Tradition, Culture, and Hidden Gems
Experience Sevilla in spring with Semana Santa processions and Feria de Abril festivities, set against the city's iconic landmarks and vibrant culture.