















 Yosemite National Park is definitely worth a visit
Vast forests, blue lakes, towering sequoias, and majestic waterfalls hint at the beauty of Yosemite National Park—a true natural masterpiece.
Sunshine plays a big role in understanding the climate of a city. This page shows the total number of hours of direct sunlight per month and the average hours per day in Solana Beach, California, United States of America. These values are calculated using 30 years of data (1990–2020) to ensure accuracy.
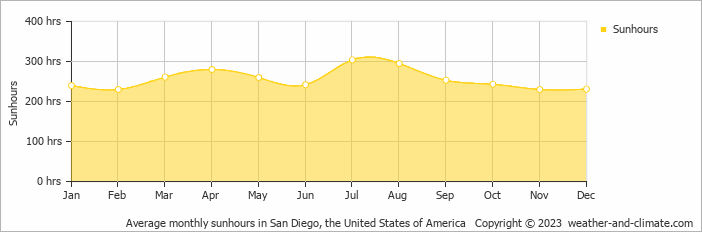
Solana Beach experiences sunny spells throughout the year. The sunniest month, July, sees up to 304 hours of sunshine, while November, the least sunny month, still provides a respectable 230 hours. The total annual sunshine amounts to 3069 hours.
The difference in daily sunshine hours between July (10.1 hours per day) and February (7.7 hours per day) offers moderate variety for visitors and residents.
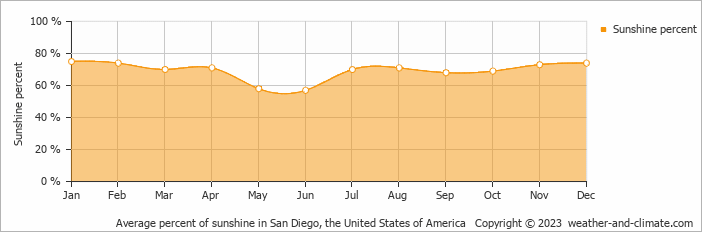
On average the sun shines 75% of the time during the day in January, the highest percentage of any month. June has the lowest percentage at 57%.
Solana Beach enjoys an average of 3069 hours of sunshine annually. Let’s compare this with some popular tourist destinations:
In Barcelona, Spain, there are 2530 hours of sunshine annually and is a city that can be visited year-round.
Manchester, UK, experiences just around 1420 hours of sunshine annually.
Stockholm, Sweden, receives approximately 1907 hours of sunshine annually.
Melbourne, Australia, has 2380 hours of sunshine annually, with its famous “four seasons in a day” weather pattern.
December, Solana Beach’s wettest month, receives 4.1 mm (0.2 in) of rainfall and has a maximum daytime temperature of 18°C (64°F). During the driest month June you can expect a temperature of 21°C (70°F).
For more detailed insights into the city’s temperatures, check out our Temperature page. To explore more about precipitation patterns, visit our Solana Beach Precipitation page.
Pick a month to see the average temperature, rainfall and sunshine in Solana Beach - and find the best time to visit.
Temperature Rainfall Sunshine Humidity
See the full Solana Beach climate overview or explore weather in the United States of America.
Where to go in October - average daytime high across popular destinations.
Miami Beach 29°C (84°F) Orlando
 29°C (84°F) Kissimmee
 29°C (84°F) Destin26°C (79°F) Los Angeles24°C (75°F) New York City19°C (66°F) Big Bear Lake19°C (66°F)
 Need travel inspiration? Check out our bucket list articles and be inspired.
Yosemite National Park is definitely worth a visit
Vast forests, blue lakes, towering sequoias, and majestic waterfalls hint at the beauty of Yosemite National Park—a true natural masterpiece.
 The 10 most alternative cities in the United States
Discover the top 10 fun and alternative U.S. cities rich in art, culture, and adventure. From Portland's hippy charm to Sedona's stunning landscapes.
 Sedona: Explore Majestic Red Rock Landscapes
A picturesque artists' town surrounded by red rocks and known for its spirituality, vortex energy, and stunning hikes like Cathedral Rock.
 10 most idyllic villages to visit in the United States
Discover 10 idyllic villages in the USA, from California to Vermont. Explore their unique charm, rich history, stunning nature, and vibrant arts scenes.