















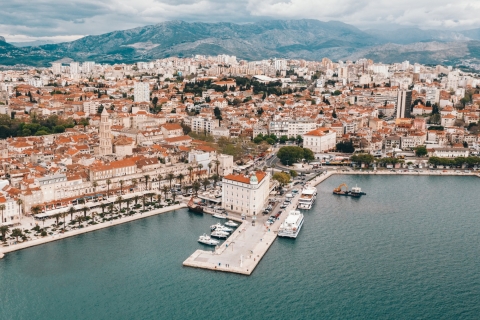
 Magical Split
The best travel time to Split in Croatia is from May til October and the best months are May, June and September.
Sunshine plays a big role in understanding the climate of a city. This page shows the total number of hours of direct sunlight per month and the average hours per day in Sarići, Croatia. These averages rely on historical data collected over 30 years, from 1990 to 2020.
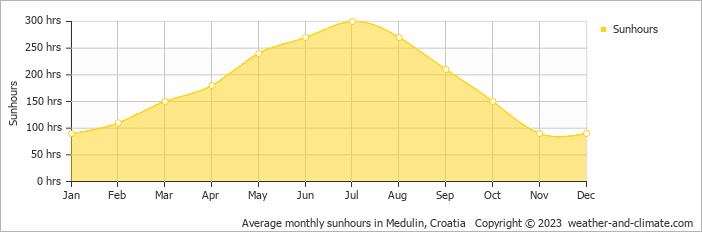
Those who love seasonal contrasts will appreciate Sarići. Expect long, bright days with 300 hours in July and darker periods with just 90 hours in December. The total annual amount of sun is 2150 hours.
This means the city can be enjoyed more throughout the sunniest month of July under a blue sky, with approximately 10.0 hours of sunshine daily. In contrast, the city experiences much darker days in January, with only 3.0 hours of sunlight per day.
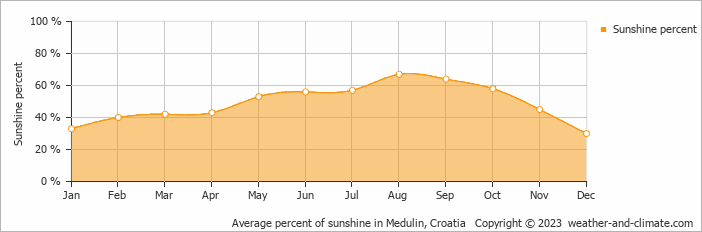
On average the sun shines 67% of the time during the day in August, the highest percentage of any month. December has the lowest percentage at 30%.
Sarići enjoys an average of 2150 hours of sunshine annually. Let’s compare this with some popular tourist destinations:
In Lisbon, Portugal, there are approximately 2801 hours of sunshine annually, highlighting its warm and sunny Mediterranean climate.
In contrast, Reykjavík, Iceland, receives only about 1330 hours of sunshine per year, known for its frequently overcast and rainy skies.
In Chicago, USA, the annual sunshine averages 2520 hours, contributing to its humid continental climate.
In Brisbane, Australia, the annual sunshine averages 2999 hours, making it one of Australia’s sunniest cities.
November, Sarići’s wettest month, receives 73 mm (2.9 in) of rainfall and has a maximum daytime temperature of 15°C (59°F). During the driest month July you can expect a temperature of 28°C (82°F).
For more detailed insights into the city’s temperatures, check out our Temperature page. To explore more about precipitation patterns, visit our Sarići Precipitation page.
Pick a month to see the average temperature, rainfall and sunshine in Sarići - and find the best time to visit.
Temperature Rainfall Sunshine Water Temp
See the full Sarići climate overview or explore weather in Croatia.
Where to go in October - average daytime high across popular destinations.
Trogir 20°C (68°F) Zadar
 21°C (70°F) Makarska
 20°C (68°F) Poreč19°C (66°F) Rovinj19°C (66°F) Pula19°C (66°F) Split20°C (68°F) Dubrovnik20°C (68°F)
 Need travel inspiration? Check out our bucket list articles and be inspired.
Magical Split
The best travel time to Split in Croatia is from May til October and the best months are May, June and September.
 Sail the crystal-clear waters of Croatia and enjoy its stunning coastline
Croatia is an idyllic sailing destination, boasting 1,777 miles (2,860 km) of beautiful beaches and pristine waters. With over 1,000 Islands dotting the Adriatic Sea, there's a perfect spot for everyone.
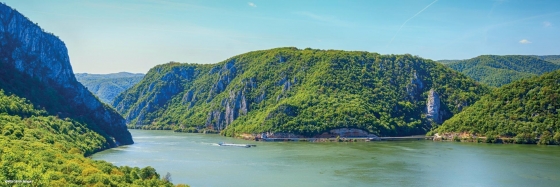
 Cycle the Danube trail
The Danube cycle route is one of the most popular cycling routes in Europe, and rightly so, because it is a varied route that is interesting both in terms of culture and nature.

 The 10 most charming villages in France
Discover France's top 10 beautiful villages. From Normandy to the Côte d'Azur, experience quaint squares and cobbled streets. Which one will you visit this summer?