Louisburgh Sunshine Hours by Month
The amount of sunshine is fundamental to comprehending a place's climate. This page shows the total number of hours of direct sunlight per month and the average hours per day in Louisburgh, Mayo, Ireland. This average is based on long-term data collected between 1990 and 2020.
Monthly hours of sunshine
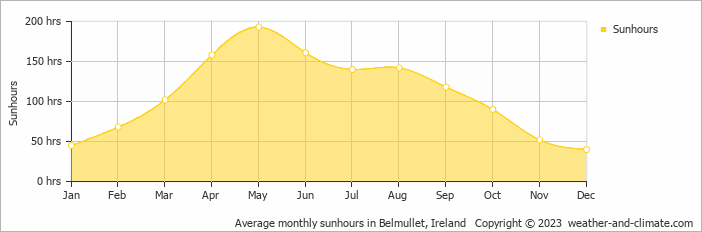
Sunshine in Louisburgh varies greatly throughout the year. The sunniest month, May, reaches an impressive 193 hours, while December, the darkest month, offers only 40 hours. The total annual amount of sun is 1309 hours.
Daily hours of sunshine
This means the city can be enjoyed more throughout the sunniest month of May under a blue sky, with approximately 6.4 hours of sunshine daily. In contrast, the city experiences much darker days in December, with only 1.3 hours of sunlight per day.
Average percent of sunshine
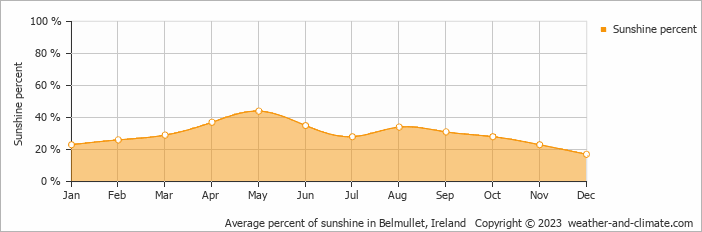
On average the sun shines 44% of the time during the day in May, the highest percentage of any month. December has the lowest percentage at 17%.
Louisburgh vs Major Cities: Sunshine Compared
Louisburgh enjoys an average of 1309 hours of sunshine annually. Let’s compare this with some popular tourist destinations:
Seville, Spain, enjoys an impressive 2920 hours of sunshine per year, making it an ideal destination even in winter.
Manchester, UK, experiences just around 1420 hours of sunshine annually.
In Seoul, South Korea, there are approximately 2133 hours of sunshine per year, mostly during spring and autumn.
Perth, Australia, enjoys 3180 hours of sunshine annually, the highest among major Australian cities.
Related Climate Data for Louisburgh
December, Louisburgh’s wettest month, receives 130 mm (5.1 in) of rainfall and has a maximum daytime temperature of 10°C (50°F). During the driest month April you can expect a temperature of 12°C (54°F).
For more detailed insights into the city’s temperatures, check out our Temperature page. To explore more about precipitation patterns, visit our Louisburgh Precipitation page.
Louisburgh Weather by Month
Pick a month to see the average temperature, rainfall and sunshine in Louisburgh - and find the best time to visit.


Louisburgh 3-Day Forecast
Temperature Rainfall Sunshine Humidity
See the full Louisburgh climate overview or explore weather in Ireland.
Popular in September
Where to go in September - average daytime high across popular destinations.
 Westport
 17°C (63°F) Doolin17°C (63°F) Kilkenny
 18°C (64°F) Cork18°C (64°F) Kenmare18°C (64°F) Killarney17°C (63°F) Galway18°C (64°F) Dublin18°C (64°F)














Bucket list
Need travel inspiration? Check out our bucket list articles and be inspired.
Go to Dingle in Ireland
Dolphins, Whales and breathtaking views. The colorful fishing village Dingle in Ireland has it all and this town is a must for your bucket list.
An Irish adventure like no other in Killarney National Park
Head down to the South West part of the country, County Kerry, to the small town of Killarney. If you want to experience what Ireland is really all about
Horseback riding in Ireland
Ireland is the most ideal place in the world for horseback riding. Combine this with the most hospitable people you will ever encounter and you have an unforgettable dream trip to add to your bucket list.
 The 10 most charming villages in France
Discover France's top 10 beautiful villages. From Normandy to the Côte d'Azur, experience quaint squares and cobbled streets. Which one will you visit this summer?