















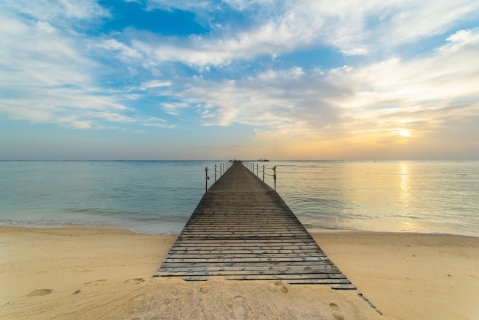
 Where to Go for Christmas: Sun, Value and Fewer Crowds
Where can you find warm Christmas weather without peak-season prices and huge crowds? Compare Marsa Alam, The Gambia, Vietnam, Agadir and Cap Skirring.
Sunshine plays a big role in understanding the climate of a city. This page shows the total number of hours of direct sunlight per month and the average hours per day in Lamin, Gambia. These averages rely on historical data collected over 30 years, from 1990 to 2020.

While the amount of sunshine in Lamin changes moderately throughout the year, the annual total remains impressive at around 2653 hours. Expect slightly brighter days in January and a subtle dip in September.
Enjoy up to 9.3 hours of daily sun in January, and experience slightly darker atmosphere in September, with about 6.0 hours of daily sunlight.
Lamin enjoys an average of 2653 hours of sunshine annually. Let’s compare this with some popular tourist destinations:
In Barcelona, Spain, there are 2530 hours of sunshine annually and is a city that can be visited year-round.
In contrast, Brussels, Belgium, receives only about 1590 hours of sunshine per year, known for its frequently overcast and rainy skies.
Stockholm, Sweden, receives approximately 1907 hours of sunshine annually.
In Brisbane, Australia, the annual sunshine averages 2999 hours, making it one of Australia’s sunniest cities.
August, Lamin’s wettest month, receives 2.3 mm (0.1 in) of rainfall and has a maximum daytime temperature of 30°C (86°F). During the driest month April you can expect a temperature of 29°C (84°F).
For more detailed insights into the city’s temperatures, check out our Temperature page. To explore more about precipitation patterns, visit our Lamin Precipitation page.
Pick a month to see the average temperature, rainfall and sunshine in Lamin - and find the best time to visit.
Temperature Rainfall Sunshine Humidity
See the full Lamin climate overview or explore weather in the Gambia.
Where to go in October - average daytime high across popular destinations.
 Gunjur
 31°C (88°F) Serekunda31°C (88°F) Bakau31°C (88°F) Bijilo31°C (88°F) Kololi31°C (88°F) Kotu31°C (88°F) Brufut31°C (88°F) Sanyang31°C (88°F)
 Need travel inspiration? Check out our bucket list articles and be inspired.
Where to Go for Christmas: Sun, Value and Fewer Crowds
Where can you find warm Christmas weather without peak-season prices and huge crowds? Compare Marsa Alam, The Gambia, Vietnam, Agadir and Cap Skirring.
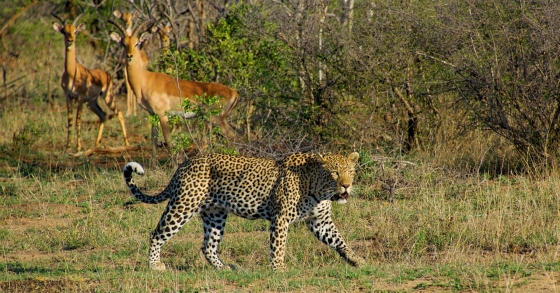
 Visit Kruger Park in South Africa
Are you going to South Africa, then you cannot skip the Kruger Park. The Kruger Park is one of the most beautiful and largest safari parks in the world.
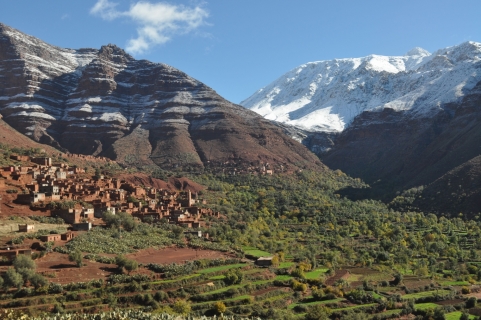
 The Atlas Mountains in Morocco
This mountain range is the second highest mountains in the world and is certainly one of the most natural and wonderful mountains you could ever visit. One for the bucket list for sure.
 One of South Africa's most spectacular private game reserves
Sabi Sand Game Reserve is one of South Africa's most spectacular private game reserves. The chance that you see the entire Big Five is high in winter (June - August).