
















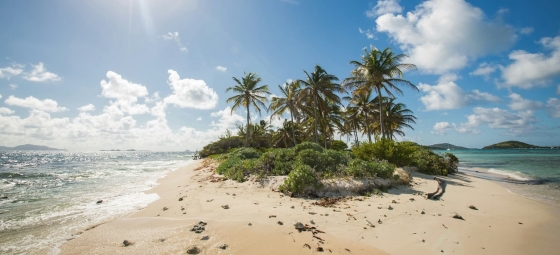
 10 Hidden gems in Asia you need to visit
Explore 10 hidden gems in Asia offering authentic experiences, from pristine beaches and remote islands to cultural treks and peaceful mountain villages.
To truly understand a climate, we must look at its sunshine. This page shows the total number of hours of direct sunlight per month and the average hours per day in Kirinda, Hambantota District, Sri Lanka. These values are calculated using 30 years of data (1990–2020) to ensure accuracy.
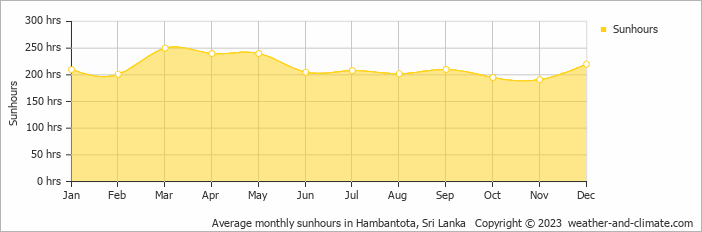
Kirinda experiences sunny spells throughout the year. The sunniest month, March, sees up to 250 hours of sunshine, while November, the least sunny month, still provides a respectable 191 hours. The total annual sunshine amounts to 2572 hours.
This means you will experience moderate variation in sunshine hours throughout the year. With 8.3 hours daily sunshine in March, it dips to 6.4 hours in November.
Kirinda enjoys an average of 2572 hours of sunshine annually. Let’s compare this with some popular tourist destinations:
The city of Rome, Italy, experiences 2470 hours of sunshine annually, adding to its charm as a year-round tourist destination.
In contrast, Reykjavík, Iceland, receives only about 1330 hours of sunshine per year, known for its frequently overcast and rainy skies.
Toronto, Canada, sees around 2071 hours of sunshine each year, with especially long, bright summer days.
In Brisbane, Australia, the annual sunshine averages 2999 hours, making it one of Australia’s sunniest cities.
November, Kirinda’s wettest month, receives 86 mm (3.4 in) of rainfall and has a maximum daytime temperature of 30°C (86°F). During the driest month July you can expect a temperature of 32°C (90°F).
For more detailed insights into the city’s temperatures, check out our Temperature page. To explore more about precipitation patterns, visit our Kirinda Precipitation page.
Pick a month to see the average temperature, rainfall and sunshine in Kirinda - and find the best time to visit.
Temperature Rainfall Sunshine Humidity Wind Speed
See the full Kirinda climate overview or explore weather in Sri Lanka.
Where to go in October - average daytime high across popular destinations.
 Colombo
 30°C (86°F) Negombo30°C (86°F) Unawatuna29°C (84°F) Galle29°C (84°F) Mirissa30°C (86°F) Hikkaduwa29°C (84°F) Kandy28°C (82°F) Nuwara Eliya27°C (81°F)
 Need travel inspiration? Check out our bucket list articles and be inspired.
10 Hidden gems in Asia you need to visit
Explore 10 hidden gems in Asia offering authentic experiences, from pristine beaches and remote islands to cultural treks and peaceful mountain villages.
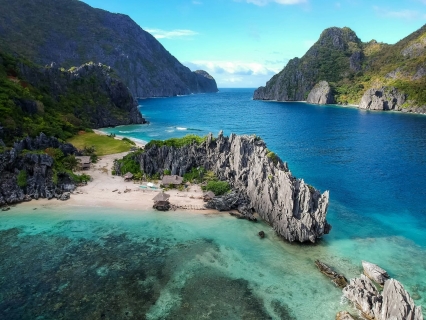 Where to Travel in July and August: Mexico, Thailand, Indonesia or Somewhere Else?
Compare July and August weather in Mexico, Thailand, Indonesia, Zanzibar and Sri Lanka, using historical climate data for temperature, rainfall and sunshine.
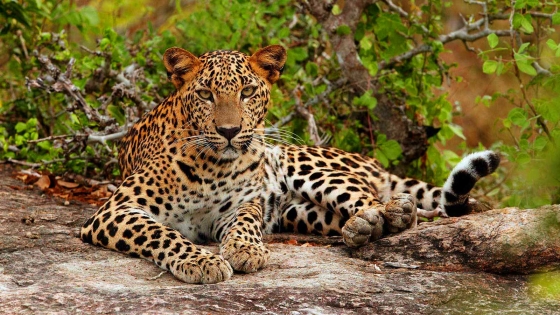 Safari at Yala West National Park
The best travel time is indicated by October to December. However from December to March you have the biggest chance to see leopards and elephants with March as the best month.
 From Hikkaduwa to Hiriketiya: where to stay on the South Coast of Sri Lanka
We have selected a few of our favorite places to stay for you. With beautiful gardens, welcoming hosts, great food - these should definitely be on your bucket list!