Kirinda Weather & Climate: Best Time to Visit
Average temperatures, rainfall, sunshine and the best time to visit Kirinda.
Climate overview of Kirinda
Kirinda, Hambantota District, Sri Lanka, has a stable climate with little temperature variation across the year. Average daytime temperatures hover around 31°C (88°F), peaking in May at 32°C (90°F) and dipping in December to 29°C (84°F).
Rainfall is high, totalling around 1221 mm (48 in) per year. November is the wettest month and July the driest. The city also experiences a distinct dry season from June to August. Sunshine peaks in March, when the city sees around 8.3 hours of sunshine per day.
Kirinda Weather by Month
Pick a month to see the average temperature, rainfall and sunshine in Kirinda - and find the best time to visit.
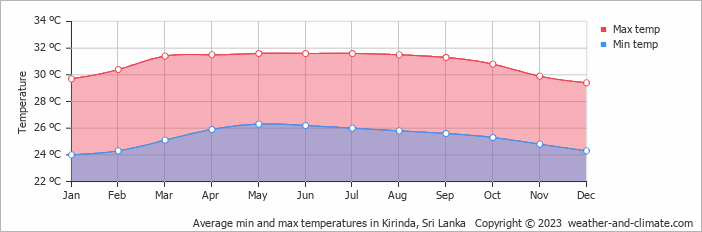
Monthly Temperature in Kirinda
With minimal seasonal shifts, Kirinda experiences a constant climate year-round. Average maximum daytime temperatures range from a very warm 32°C (90°F) in May, the warmest time of the year, to a comfortable 29°C (84°F) during cooler months like December.
At night, you can expect temperatures ranging from 26°C (79°F) in May to around 24°C (75°F) during December.
Check out our detailed temperature page for more information.
Temperature ranges by month
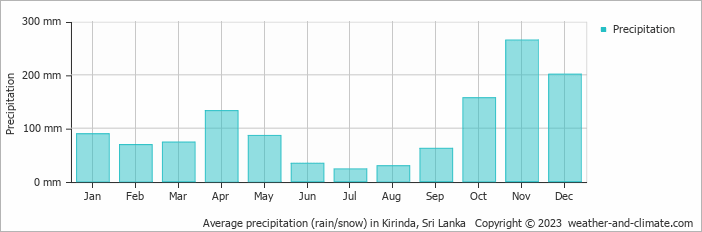
Rainfall in Kirinda
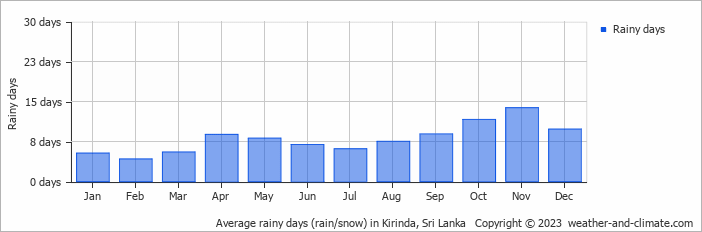
Kirinda has a notably wet climate with abundant precipitation, recording 1221 mm (48 in) of rainfall per year. Significant seasonal changes in precipitation occur throughout the year. In the wettest month, November it receives heavy rainfall, averaging 265 mm (10 in) of precipitation, recorded across 14 rainy days. In contrast, the driest month July brings less rainfall, with 23 mm (0.9 in) over 6 rainy days. For more details, please visit our Kirinda Precipitation page.
The mean monthly precipitation over the year, including rain, hail, and snow
The average number of days each month with precipitation
Sunshine Hours in Kirinda
While the amount of sunshine in Kirinda varies throughout the year, all seasons offer their own charm. Enjoy up to 8.3 hours of daily sun in March, and experience slightly darker atmosphere in November, with about 6.4 hours of daily sunlight.
Visit our detailed sunshine hours page for more information.
Monthly hours of sunshine
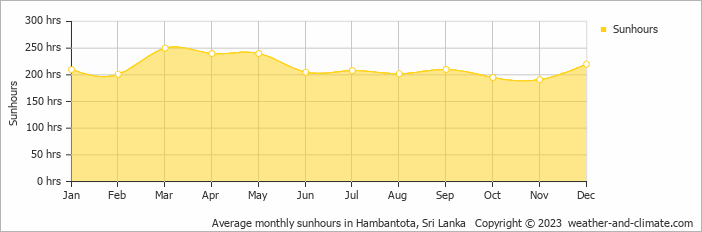
Daily hours of sunshine
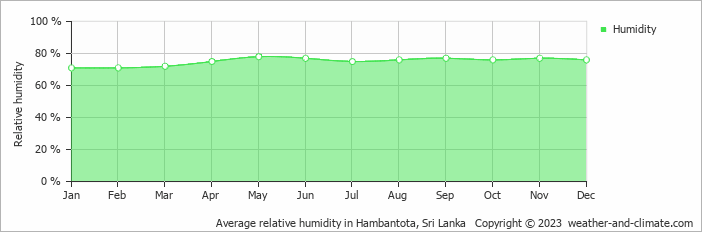
Humidity in Kirinda by Month
The relative humidity is high throughout the year in Kirinda.
The city experiences its highest humidity in May, reaching 78%. In January, the humidity drops to its lowest level at 71%. What does this mean? Read our detailed page on humidity levels for further details.
Relative humidity over the year
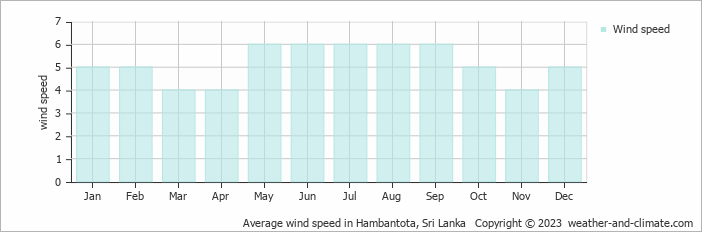
Wind Speed in Kirinda
The mean wind speed over the year ranges from 4 m/s (8 knots) in March, April and November to 6 m/s (12 knots) in May, June, July, August and September. What does this mean?
The mean monthly wind speed over the year (meters per second)
Best Time to Visit Kirinda
Monthly ratings reflect general weather comfort, based on daytime temperature and rainfall. Swimming and winter conditions are highlighted separately where relevant.
- Best overall: July and August
- Warmest weather: February, March, April, May, June, July, August, September and October
- Most sunshine: March, April and May
- Fewest rainy days: January, February, March and July
- Wettest months: October, November and December, when rainfall is highest.
- Seasonal pattern: A distinct dry season from June to August
Frequently asked questions about the climate in Kirinda
What is the best time to visit Kirinda?
July and August typically offer the most optimal weather in Kirinda. In contrast, November tends to have less optimal conditions. Kirinda has a distinct dry season from June to August.
What temperatures can I expect in Kirinda?
Daytime highs range from 29°C (84°F) in December to 32°C (90°F) in May. Nighttime lows range from 24°C (75°F) to 26°C (79°F). Temperatures stay relatively stable year-round.
How much rain does Kirinda get?
Annual rainfall is around 1221 mm (48 in). November is the wettest month with 265 mm (10 in), while July is the driest with 23 mm (0.9 in).
How sunny is Kirinda?
Kirinda receives around 2,572 hours of sunshine per year. March is the sunniest month with 250 hours, while November is the cloudiest with just 191 hours. Overall, Kirinda enjoys abundant sunshine.
Kirinda 3-Day Forecast
Kirinda 3-Day Forecast
Kirinda on the map
Kirinda is highlighted - select any city to see its climate.
Popular this month
Where to go in July - average daytime high across popular destinations.
Bucket list
Need travel inspiration? Check out our bucket list articles and be inspired.
 10 Hidden gems in Asia you need to visit
Explore 10 hidden gems in Asia offering authentic experiences, from pristine beaches and remote islands to cultural treks and peaceful mountain villages.
 Safari at Yala West National Park
The best travel time is indicated by October to December. However from December to March you have the biggest chance to see leopards and elephants with March as the best month.
From Hikkaduwa to Hiriketiya: where to stay on the South Coast of Sri Lanka
We have selected a few of our favorite places to stay for you. With beautiful gardens, welcoming hosts, great food - these should definitely be on your bucket list!
Visit Adams Peak
Adam's Peak is a holy mountain which pilgrims visit for over a thousand years. Here Adam (according to the Christians) would have set his first footstep after being sent down from heaven.