
















 An alternative way to discover Sydney
We have made an overview of the sights in Sydney that you must see if you want to visit Sydney in an alternative way.
When exploring climate, sunlight hours tell an important story. This page shows the total number of hours of direct sunlight per month and the average hours per day in Hindmarsh Valley, South Australia, Australia. Long-term data from 1990 to 2020 was used to calculate these averages.
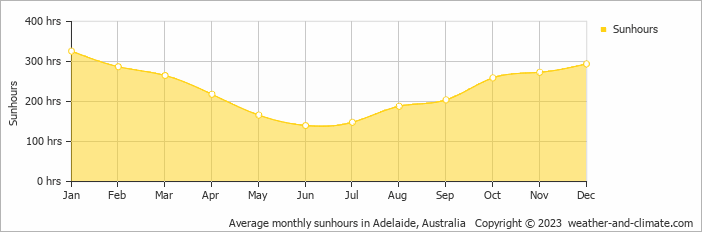
Seasonal sunshine in Hindmarsh Valley varies. It peaks at 326 hours in January and drops to 140 hours in June. The total annual amount of sun is 2768 hours.
In Hindmarsh Valley, summer days are longer and more sunny, with daily sunshine hours peaking at 10.9 hours in January. As the darker season arrives, the brightness of the sun becomes less. June sees a soft sun for only 4.7 hours per day.
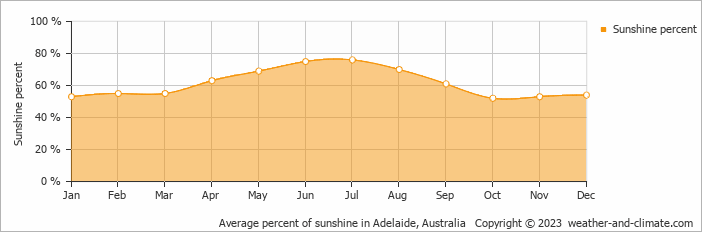
On average the sun shines 76% of the time during the day in July, the highest percentage of any month. October has the lowest percentage at 52%.
Hindmarsh Valley enjoys an average of 2768 hours of sunshine annually. Let’s compare this with some popular tourist destinations:
Seville, Spain, enjoys an impressive 2920 hours of sunshine per year, making it an ideal destination even in winter.
In contrast, Juneau, Alaska, receives only about 1523 hours of sunshine per year and is known for its very short days in winter and frequently overcast conditions.
In Chicago, USA, the annual sunshine averages 2520 hours, contributing to its humid continental climate.
Perth, Australia, enjoys 3180 hours of sunshine annually, the highest among major Australian cities.
July, Hindmarsh Valley’s wettest month, receives 22 mm (0.9 in) of rainfall and has a maximum daytime temperature of 15°C (59°F). During the driest month March you can expect a temperature of 24°C (75°F).
For more detailed insights into the city’s temperatures, check out our Temperature page. To explore more about precipitation patterns, visit our Hindmarsh Valley Precipitation page.
Pick a month to see the average temperature, rainfall and sunshine in Hindmarsh Valley - and find the best time to visit.
Temperature Rainfall Sunshine Humidity
See the full Hindmarsh Valley climate overview or explore weather in Australia.
Where to go in October - average daytime high across popular destinations.
Noosa Heads 25°C (77°F) Brisbane
 26°C (79°F) Byron Bay24°C (75°F) Gold Coast
 24°C (75°F) Perth23°C (73°F) Sydney22°C (72°F) Adelaide20°C (68°F) Melbourne20°C (68°F)
 Need travel inspiration? Check out our bucket list articles and be inspired.
An alternative way to discover Sydney
We have made an overview of the sights in Sydney that you must see if you want to visit Sydney in an alternative way.
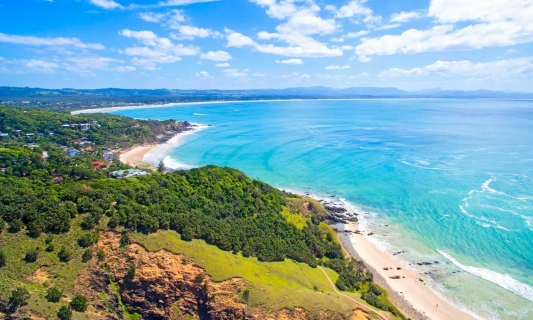 The most relaxed and alternative area of Australia is called the Byron Shire
The Byron Shire is one of the most pretty areas in the world. Not only in terms on natural beauty, also the relaxed vibe and people make this an area that remains close to your heart.
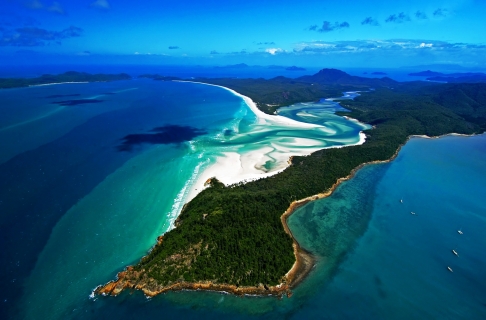 Sail the Whitsunday islands
The best travel period to sail the Whitsunday islands is “winter” between June and October, with pleasant temperatures around 23 degrees Celsius (74 Fahrenheit).
 The best dive spots in Australia
Explore Australia's best dive spots: from the Great Barrier Reef to HMAS Perth. Discover vibrant corals, marine life, and historic wrecks.