Chambok Weather & Climate: Best Time to Visit
Average temperatures, rainfall, sunshine and the best time to visit Chambok.
Climate overview of Chambok
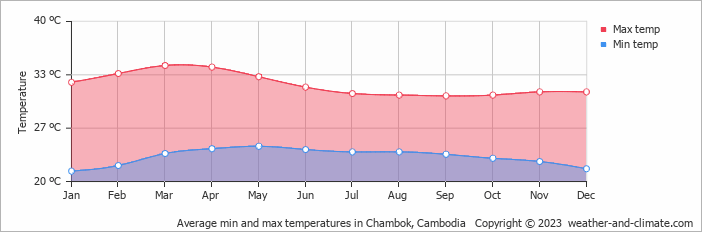
Chambok, Kampong Cham Province, Cambodia, has a stable climate with little temperature variation across the year. Average daytime temperatures hover around 32°C (90°F), peaking in March at 35°C (95°F) and dipping in September to 31°C (88°F).
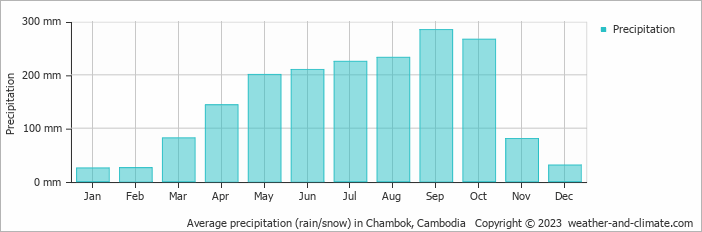
The city receives considerable rainfall, with around 1805 mm (71 in) annually. September is the wettest month. It has distinct dry (December to February) and wet (May to October) seasons.
Chambok Weather by Month
Pick a month to see the average temperature, rainfall and sunshine in Chambok - and find the best time to visit.


Monthly Temperature in Chambok
With minimal seasonal shifts, Chambok experiences a constant climate year-round. Typically, average maximum daytime temperatures range from a very warm 35°C (95°F) in March to a very warm 31°C (88°F) in the coolest month, September.
Nights vary from 24°C (75°F) in March to around 21°C (70°F) during the colder months.
Check out our detailed temperature page for more information.
Temperature ranges by month
Rainfall in Chambok
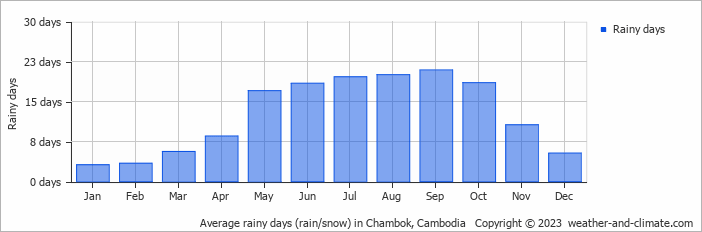
Chambok has a notably wet climate with abundant precipitation, recording 1805 mm (71 in) of rainfall per year. The climate in Chambok shows significant variation throughout the year. Expect heavy rainfall in September, the wettest month, with an average of 285 mm (11 in) of precipitation over 21 rainy days.
In contrast, the driest month January offers drier and sunnier days, with around 25 mm (1 in) of rainfall over 3 rainy days. For more details, please visit our Chambok Precipitation page.
The mean monthly precipitation over the year, including rain, hail, and snow
The average number of days each month with precipitation
Best Time to Visit Chambok
Monthly ratings reflect general weather comfort, based on daytime temperature and rainfall. Swimming and winter conditions are highlighted separately where relevant.
- Best overall: January
- Warmest weather: February, March, April and May
- Fewest rainy days: January and February
- Wettest months: May, June, July, August, September and October, when rainfall is highest.
- Seasonal pattern: Distinct dry (December to February) and wet (May to October) seasons
Frequently asked questions about the climate in Chambok
What is the best time to visit Chambok?
January typically offers the most optimal weather in Chambok. In contrast, February, March, April, May, June, July, August, September and October tend to have less optimal conditions. Chambok has distinct dry (December to February) and wet (May to October) seasons.
What temperatures can I expect in Chambok?
Daytime highs range from 31°C (88°F) in September to 35°C (95°F) in March. Nighttime lows range from 21°C (70°F) to 24°C (75°F). Temperatures stay relatively stable year-round.
How much rain does Chambok get?
Annual rainfall is around 1805 mm (71 in). September is the wettest month with 285 mm (11 in), while January is the driest with 25 mm (1 in).
Chambok 3-Day Forecast
Chambok on the map
Chambok is highlighted - select any city to see its climate.
Popular this month
Where to go in September - average daytime high across popular destinations.
 Battambang
 34°C (93°F) Phnom Penh33°C (91°F) Siem Reap33°C (91°F) Kep30°C (86°F) Chambok31°C (88°F) Koh Rong Island29°C (84°F) Kampot30°C (86°F) Sihanoukville29°C (84°F)















Bucket list
Need travel inspiration? Check out our bucket list articles and be inspired.
 10 Hidden gems in Asia you need to visit
Explore 10 hidden gems in Asia offering authentic experiences, from pristine beaches and remote islands to cultural treks and peaceful mountain villages.
Staying in an artwork
Situated between three of Cambodia's oldest nature parks you can find a work of art created by world-famous architect Bill Bensley called Shinta Mani Wild.
Exploring Cambodia by Bicycle
Discover the wonders of Cambodia on a bicycle tour, exploring its history, culture, and breathtaking landscapes. Ideal for all levels of cyclists.