


















 Do a pub crawl in Antwerp
You can visit Antwerp year round however May through September is the best time to go to Antwerp for a pub crawl. Late spring is recommended for its long days.
Sunshine plays a big role in understanding the climate of a city. This page shows the total number of hours of direct sunlight per month and the average hours per day in Bree, Limburg, Belgium. Long-term data from 1990 to 2020 was used to calculate these averages.
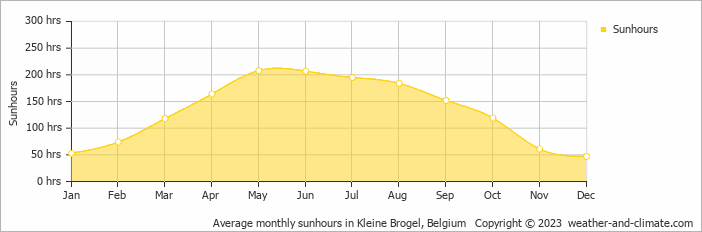
Sunshine in Bree varies greatly throughout the year. The sunniest month, May, reaches an impressive 208 hours, while December, the darkest month, offers only 47 hours. The total annual amount of sun is 1582 hours.
For those who appreciate different seasons, Bree serves as an ideal destination. Expect longer, more sun-filled days in May with an average of 6.9 hours of sunshine daily, and embrace the darker days in December, offering only 1.6 hours of daily sunlight.
Bree enjoys an average of 1582 hours of sunshine annually. Let’s compare this with some popular tourist destinations:
In Barcelona, Spain, there are 2530 hours of sunshine annually and is a city that can be visited year-round.
Manchester, UK, experiences just around 1420 hours of sunshine annually.
Boston, USA, enjoys 2629 hours of sunshine annually, with distinct seasons and many bright, sunny days.
Melbourne, Australia, has 2380 hours of sunshine annually, with its famous “four seasons in a day” weather pattern.
July, Bree’s wettest month, receives 83 mm (3.3 in) of rainfall and has a maximum daytime temperature of 25°C (77°F). During the driest month April you can expect a temperature of 16°C (61°F).
For more detailed insights into the city’s temperatures, check out our Temperature page. To explore more about precipitation patterns, visit our Bree Precipitation page.
Pick a month to see the average temperature, rainfall and sunshine in Bree - and find the best time to visit.
Temperature Rainfall Sunshine Humidity Wind Speed
See the full Bree climate overview or explore weather in Belgium.
Where to go in October - average daytime high across popular destinations.
Knokke-Heist 16°C (61°F) Blankenberge16°C (61°F) Ghent16°C (61°F) Antwerp16°C (61°F) Ostend16°C (61°F) Brussels16°C (61°F) Bruges16°C (61°F) Durbuy14°C (57°F)
 Need travel inspiration? Check out our bucket list articles and be inspired.
Do a pub crawl in Antwerp
You can visit Antwerp year round however May through September is the best time to go to Antwerp for a pub crawl. Late spring is recommended for its long days.
 Discover the green beauty of Belgium's Ardennes
Uncover Belgium's Ardennes: Outdoor adventures, history, relaxation, and local delights await in this green travel paradise

 The 10 most charming villages in France
Discover France's top 10 beautiful villages. From Normandy to the Côte d'Azur, experience quaint squares and cobbled streets. Which one will you visit this summer?

 The train journey from Bucharest to Brasov is one of the most beautiful in Romania
In three hours, you'll get from Bucharest to Brasov by train. It is one of the most beautiful routes in Romania, certainly the most beautiful that can be done by express train.