


















 Do a pub crawl in Antwerp
You can visit Antwerp year round however May through September is the best time to go to Antwerp for a pub crawl. Late spring is recommended for its long days.
The mean monthly wind speed over the year in Richelle (Liege Province), Belgium.
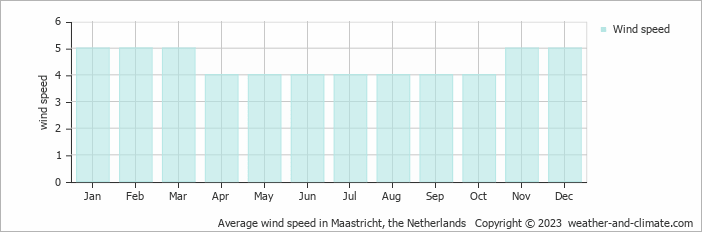
Annually, wind speeds in Richelle vary between 4 m/s (8 knots) at their lowest and 5 m/s (10 knots) at their peak.
During April, May, June, July, August, September and October, wind speed averages 4 m/s (8 knots), creating notably breezy conditions. Daily fluctuations span from gentle winds to more substantial gusts. At the average speed of 4 m/s (8 knots), small tree branches show continuous swaying motion. This wind strength equals 14.4 kilometers per hour or 8.9 miles per hour. Most plans remain feasible, though some days bring conditions strong enough to affect certain sports.
Wind speeds average 5 m/s (10 knots) during January, February, March, November and December, making these the windiest months of the year. Most days bring strong winds that can sway small trees and make walking more challenging. Umbrellas are difficult to manage. The average speed of 5 m/s equals 18 km/h or 11.2 mph. While calmer intervals or stronger gusts may occur, breezy conditions are typical throughout this period. It's generally a great time for flying a kite or going windsurfing.
For more detailed information about Richelle’s weather, including monthly rainfall, sunshine hours, and humidity levels, visit our Richelle climate page.
Pick a month to see the average temperature, rainfall and sunshine in Richelle - and find the best time to visit.
Temperature Rainfall Sunshine Humidity Wind Speed
See the full Richelle climate overview or explore weather in Belgium.
Where to go in October - average daytime high across popular destinations.
Knokke-Heist 16°C (61°F) Blankenberge16°C (61°F) Ghent16°C (61°F) Antwerp16°C (61°F) Ostend16°C (61°F) Brussels16°C (61°F) Bruges16°C (61°F) Durbuy14°C (57°F)
 Need travel inspiration? Check out our bucket list articles and be inspired.
Do a pub crawl in Antwerp
You can visit Antwerp year round however May through September is the best time to go to Antwerp for a pub crawl. Late spring is recommended for its long days.
 Discover the green beauty of Belgium's Ardennes
Uncover Belgium's Ardennes: Outdoor adventures, history, relaxation, and local delights await in this green travel paradise

 The 10 most charming villages in France
Discover France's top 10 beautiful villages. From Normandy to the Côte d'Azur, experience quaint squares and cobbled streets. Which one will you visit this summer?

 The train journey from Bucharest to Brasov is one of the most beautiful in Romania
In three hours, you'll get from Bucharest to Brasov by train. It is one of the most beautiful routes in Romania, certainly the most beautiful that can be done by express train.