














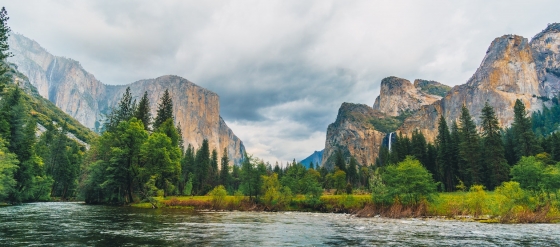
 Yosemite National Park is definitely worth a visit
Vast forests, blue lakes, towering sequoias, and majestic waterfalls hint at the beauty of Yosemite National Park—a true natural masterpiece.
On this page you will find more information about the mean monthly wind speed over the year in Lynwood (California), the United States of America.
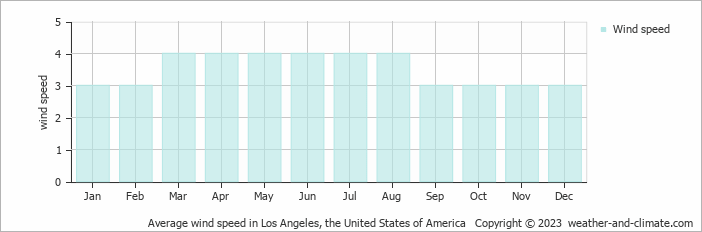
The mean wind speed in Lynwood over the year fluctuates between 3 m/s (6 knots) and 4 m/s (8 knots).
The average wind speed is 3 m/s (6 knots) during January, February, September, October, November and December, indicating consistent yet manageable airflow. Daily conditions vary, with some days bringing stronger breezes. At the average speed, foliage moves steadily, and flags show noticeable motion. In common units, this equals about 11 kilometers per hour or 6.7 miles per hour. Overall, it's are pleasant months to be outdoors in terms of wind conditions.
Wind speeds average 4 m/s (8 knots) during March, April, May, June, July and August; these fall in the windiest period. This means most days are noticeably windy with small branches moving constantly. Dust gets lifted and papers blow around. The measurement represents 14.4 km/h or 8.9 mph. There may still be stronger gusts or calmer moments, but breezy conditions are typical.
For more detailed information about Lynwood’s weather, including monthly rainfall, sunshine hours, and humidity levels, visit our Lynwood climate page.
Pick a month to see the average temperature, rainfall and sunshine in Lynwood - and find the best time to visit.
Temperature Rainfall Sunshine Humidity Wind Speed Water Temp
See the full Lynwood climate overview or explore weather in the United States of America.
Where to go in October - average daytime high across popular destinations.
Miami Beach 29°C (84°F) Orlando
 29°C (84°F) Kissimmee
 29°C (84°F) Destin26°C (79°F) Los Angeles24°C (75°F) New York City19°C (66°F) Big Bear Lake19°C (66°F)
 Need travel inspiration? Check out our bucket list articles and be inspired.
Yosemite National Park is definitely worth a visit
Vast forests, blue lakes, towering sequoias, and majestic waterfalls hint at the beauty of Yosemite National Park—a true natural masterpiece.
 The 10 most alternative cities in the United States
Discover the top 10 fun and alternative U.S. cities rich in art, culture, and adventure. From Portland's hippy charm to Sedona's stunning landscapes.
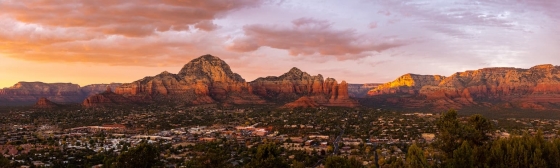 Sedona: Explore Majestic Red Rock Landscapes
A picturesque artists' town surrounded by red rocks and known for its spirituality, vortex energy, and stunning hikes like Cathedral Rock.
 10 most idyllic villages to visit in the United States
Discover 10 idyllic villages in the USA, from California to Vermont. Explore their unique charm, rich history, stunning nature, and vibrant arts scenes.