
















 An alternative way to discover Sydney
We have made an overview of the sights in Sydney that you must see if you want to visit Sydney in an alternative way.
Here you can view the typical wind conditions throughout the year in Casuarina, (Northern Territory), Australia.
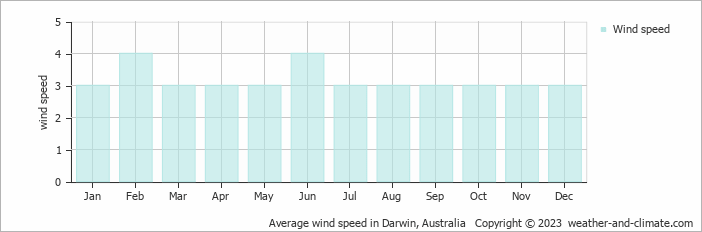
Annually, wind speeds in Casuarina vary between 3 m/s (6 knots) at their lowest and 4 m/s (8 knots) at their peak.
With an average wind speed of 3 m/s (6 knots) in January, March, April, May, July, August, September, October, November and December, it experiences a fair and typical breeze. However, conditions can vary between days, and stronger winds may occasionally occur. On a day with 3 m/s (6 knots), leaves and small twigs are constantly in motion, and a flag would be clearly waving. This translates to roughly 11 km/h or 6.7 mph. Most days are suitable for spending time outdoors.
The windiest time of year, February and June has average wind speeds of 4 m/s (8 knots). This means typical days have strong breezes that make flags snap and clothing flap. Walking against the wind takes slight effort. The speed translates to 14.4 kilometers per hour or 8.9 miles per hour. While some periods are calmer or gustier, windy weather is the norm.
For more detailed information about Casuarina’s weather, including monthly rainfall, sunshine hours, and humidity levels, visit our Casuarina climate page.
Pick a month to see the average temperature, rainfall and sunshine in Casuarina - and find the best time to visit.
Temperature Rainfall Sunshine Humidity Wind Speed Water Temp
See the full Casuarina climate overview or explore weather in Australia.
Where to go in October - average daytime high across popular destinations.
Noosa Heads 25°C (77°F) Brisbane
 26°C (79°F) Byron Bay24°C (75°F) Gold Coast
 24°C (75°F) Perth23°C (73°F) Sydney22°C (72°F) Adelaide20°C (68°F) Melbourne20°C (68°F)
 Need travel inspiration? Check out our bucket list articles and be inspired.
An alternative way to discover Sydney
We have made an overview of the sights in Sydney that you must see if you want to visit Sydney in an alternative way.
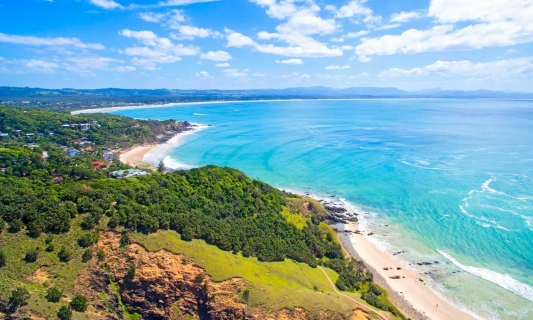 The most relaxed and alternative area of Australia is called the Byron Shire
The Byron Shire is one of the most pretty areas in the world. Not only in terms on natural beauty, also the relaxed vibe and people make this an area that remains close to your heart.
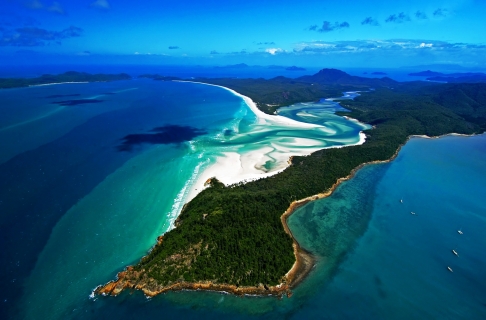 Sail the Whitsunday islands
The best travel period to sail the Whitsunday islands is “winter” between June and October, with pleasant temperatures around 23 degrees Celsius (74 Fahrenheit).
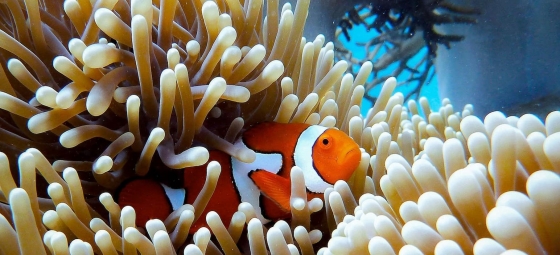 The best dive spots in Australia
Explore Australia's best dive spots: from the Great Barrier Reef to HMAS Perth. Discover vibrant corals, marine life, and historic wrecks.