
















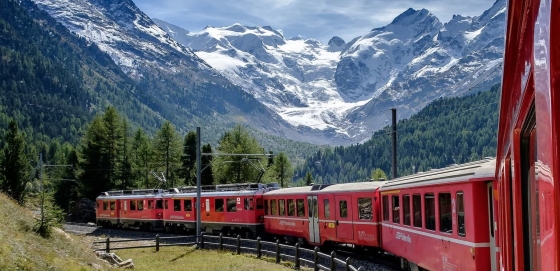
 The 5 most scenic train journeys in Switzerland
Explore Switzerland's top 5 train journeys, featuring breathtaking Alpine views and engineering marvels like the Glacier Express and Bernina Express.
The mean monthly wind speed over the year in Brunnen (Canton of Schwyz), Switzerland.
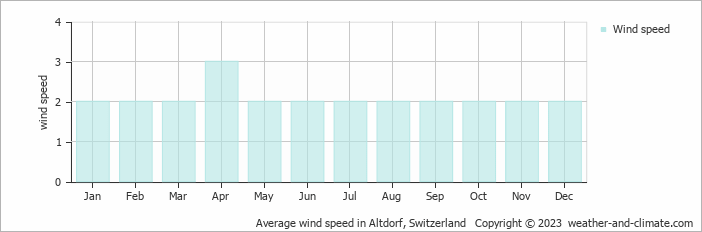
The average annual wind speed in Brunnen spans from 2 m/s (4 knots) to 3 m/s (6 knots).
During January, February, March, May, June, July, August, September, October, November and December, Brunnen maintains a 2 m/s (4 knots) wind speed average, producing gentle air movement. Some days will be calm while others may experience more wind. At the average speed, you'll feel light air pressure on exposed skin and observe subtle leaf movement. Converting to familiar units, this equals 7.2 km/h or 4.5 mph. Despite occasional breezes, the wind is usually light enough to spend time outdoors.
Wind speeds average 3 m/s (6 knots) during April; these months represent as the windiest period. This means most days have a steady breeze that moves leaves and light flags. Wind is felt clearly but remains comfortable. The measurement represents 10.8 km/h or 6.7 mph. Some days are calmer while others have stronger winds up to 6 m/s (12 knots).
For more detailed information about Brunnen’s weather, including monthly rainfall, sunshine hours, and humidity levels, visit our Brunnen climate page.
Pick a month to see the average temperature, rainfall and sunshine in Brunnen - and find the best time to visit.
Temperature Rainfall Sunshine Humidity Wind Speed
See the full Brunnen climate overview or explore weather in Switzerland.
Where to go in October - average daytime high across popular destinations.
Zürich 15°C (59°F) Crans-Montana10°C (50°F) Engelberg10°C (50°F) Nendaz10°C (50°F) Davos8°C (46°F) Saas-Fee
 7°C (45°F) Grindelwald8°C (46°F) Zermatt6°C (43°F)
 Need travel inspiration? Check out our bucket list articles and be inspired.
The 5 most scenic train journeys in Switzerland
Explore Switzerland's top 5 train journeys, featuring breathtaking Alpine views and engineering marvels like the Glacier Express and Bernina Express.
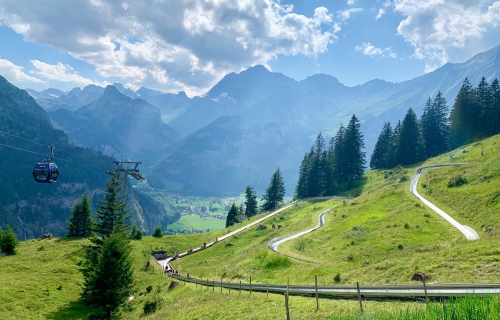 You'll love this Mountain roller coaster
Hotel Oeschinensee’s mountain coaster is a summer toboggan that you want to add to your bucket list. You'll get in your cart, sit down and fly across the track while enjoying the beautiful mountain scenery around you.
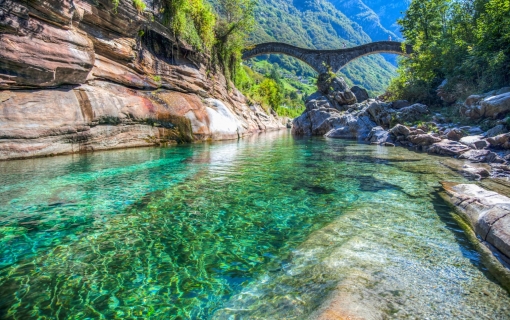 The Verzasca Valley
You can visit the Verzasca Valley in any season. It's an amazing place for swimming and it is a paradise for hikers. A must see for the bucket list.
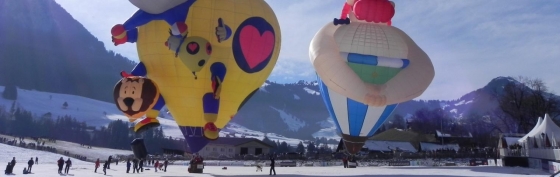 Balloon at Chateau D'oex
If you are looking for a special place to visit in Europe in January we recommend visiting the annual balloon festival in Château-d'Oex, Switzerland.