


















 Do a pub crawl in Antwerp
You can visit Antwerp year round however May through September is the best time to go to Antwerp for a pub crawl. Late spring is recommended for its long days.
On this page you will find more information about the mean monthly wind speed over the year in Baarle-Hertog (Antwerpen Province), Belgium.
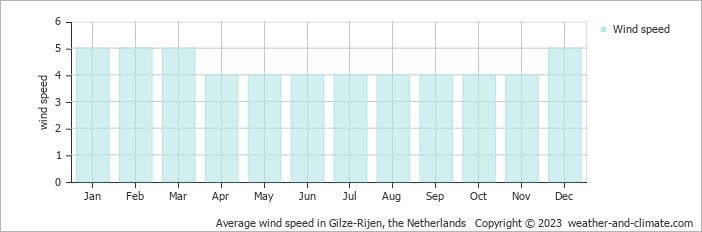
Throughout the year, wind speeds in Baarle-Hertog average from 4 m/s (8 knots) and increase to 5 m/s (10 knots).
The 4 m/s (8 knots) average in April, May, June, July, August, September, October and November means Baarle-Hertog experiences consistent moderate winds. Conditions vary from calm periods around to more active episodes throughout the month. At typical wind levels, smaller trees show steady branch movement. In common units, 4 m/s (8 knots) equals 14.4 km/h or 8.9 mph. While generally comfortable for most activities, occasional windy days may affect your plans and can make the air feel cooler.
Wind speeds average 5 m/s (10 knots) in , marking the windiest months of the year. The air is often steady and noticeable throughout the month, though occasional stronger gusts or brief calms may occur. Windy conditions are typical during this period, making it a great time for activities like windsurfing and kitesurfing.
For more detailed information about Baarle-Hertog’s weather, including monthly rainfall, sunshine hours, and humidity levels, visit our Baarle-Hertog climate page.
Pick a month to see the average temperature, rainfall and sunshine in Baarle-Hertog - and find the best time to visit.
Temperature Rainfall Sunshine Humidity Wind Speed
See the full Baarle-Hertog climate overview or explore weather in Belgium.
Where to go in October - average daytime high across popular destinations.
Knokke-Heist 16°C (61°F) Blankenberge16°C (61°F) Ghent16°C (61°F) Antwerp16°C (61°F) Ostend16°C (61°F) Brussels16°C (61°F) Bruges16°C (61°F) Durbuy14°C (57°F)
 Need travel inspiration? Check out our bucket list articles and be inspired.
Do a pub crawl in Antwerp
You can visit Antwerp year round however May through September is the best time to go to Antwerp for a pub crawl. Late spring is recommended for its long days.
 Discover the green beauty of Belgium's Ardennes
Uncover Belgium's Ardennes: Outdoor adventures, history, relaxation, and local delights await in this green travel paradise

 The 10 most charming villages in France
Discover France's top 10 beautiful villages. From Normandy to the Côte d'Azur, experience quaint squares and cobbled streets. Which one will you visit this summer?

 The train journey from Bucharest to Brasov is one of the most beautiful in Romania
In three hours, you'll get from Bucharest to Brasov by train. It is one of the most beautiful routes in Romania, certainly the most beautiful that can be done by express train.