



















 The rise of eco-friendly tourism in Suriname
Suriname is a haven for anyone looking to experience eco-friendly tourism at its finest with its pristine beaches, towering rainforests, and vibrant indigenous culture.
On this page you will find more information about the mean monthly wind speed over the year in Nieuw Nickerie (), Suriname.
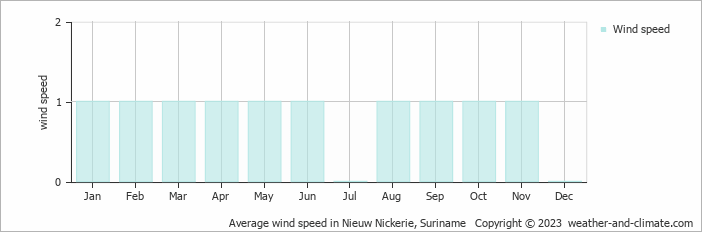
Wind speed in Nieuw Nickerie varies across the year, ranging from () to 1 m/s (2 knots).
Wind speeds average 1 m/s (2 knots) during January, February, March, April, May, June, August, September, October and November. This means the air is mostly calm on typical days. Flags hang down and smoke rises straight up most of the time. The measurement represents 3.6 km/h or 2.2 mph. Some days are completely still while others have weak breezes up to 3 m/s (6 knots).
For more detailed information about Nieuw Nickerie’s weather, including monthly rainfall, sunshine hours, and humidity levels, visit our Nieuw Nickerie climate page.
Pick a month to see the average temperature, rainfall and sunshine in Nieuw Nickerie - and find the best time to visit.
Temperature Rainfall Sunshine Humidity Wind Speed Water Temp
See the full Nieuw Nickerie climate overview or explore weather in Suriname.
Where to go in October - average daytime high across popular destinations.
Need travel inspiration? Check out our bucket list articles and be inspired.
The rise of eco-friendly tourism in Suriname
Suriname is a haven for anyone looking to experience eco-friendly tourism at its finest with its pristine beaches, towering rainforests, and vibrant indigenous culture.

 Visit the Rainbow Mountains
The Rainbow Mountain (Vinicunca) is acolored rainbow mountain that will steal your heart forever and the view from the top will take your breath away.

 The 10 most alternative cities in South America
Discover South America's top 10 alternative cities! From Valparaíso's vibrant streets to La Paz's high-altitude charm and Medellín's innovative spirit.

 The 5 most tranquil retreats in the Amazon Rainforest, Brazil
Discover top sustainable lodges in the Amazon. Enjoy unique wildlife, eco-friendly stays, and immersive experiences at Anavilhanas, Cristalino, and more.