ClimateForecastAprilMay >>

Average monthly rainy days in Puerto Clocker

The number of days each month with rain, snow and hail in Puerto Clocker (Los Lagos), Chile.

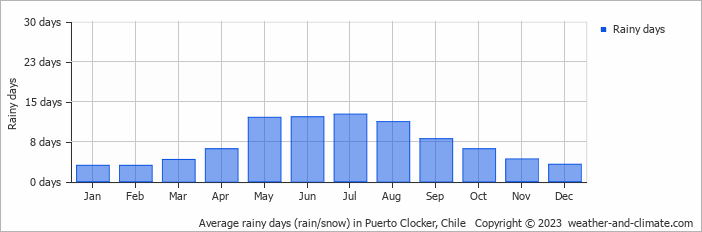
  • On average, July is the most rainy with 12 days of rain/snow.
  • On average, January is the driest month with 3 rainy days.
  • The average annual number of rainy days is 85.

Weather Forecasts for Puerto Clocker

Mon   Apr 29
10°C | 4°C
N 32 km/h
45 mm
overcast and heavy rain

overcast and heavy rain

Tue   Apr 30
8°C | 2°C
N 18 km/h
13 mm
partly cloudy and rain

partly cloudy and rain

Wed   May 01
8°C | 3°C
N 14 km/h
8.5 mm
overcast and rain

overcast and rain

Interested in more climate information?

Weather and Climate provides you with all the information you need about the climate in Puerto Clocker.

Our site offers climate and forecast data for every country in the world. Are you going to Chile? On this website you can find historical weather averages for many cities in Chile. Not sure yet where to go? We now have a tool which recommends destinations that suit your ideal climate conditions. Find out where to go with our weather planner.