Average Rainy - Precipitation days in Casargo
With 168 days and 1779 mm of annual rain/snow, Casargo has a moderate precipitation pattern. On this page, you can learn everything about the number of precipitation days.
Monthly Distribution of Rainy Days
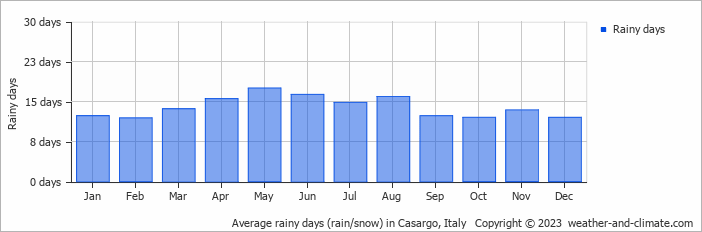
Precipitation peaks in June with 200 mm falling over 16 rainy days. The driest period is January, receiving 70 mm across 12 snowy/rainy days.
Amsterdam Precipitation Days Compared World Wide
On average, Casargo receives over 168 days of precipitation annually. For comparison, here is some data from popular tourist destinations around the world:In Cairo, Egypt, there are only about 16 precipitation days annually, making it one of the driest capitals in the world.
In Bogotá, Colombia, there are around 188 precipitation days annually, typical for its high-altitude tropical climate.
In Lisbon, Portugal, there are an average of 113 precipitation days annually, characterized by wet winters and dry summers typical of the Mediterranean climate.
Every year, the city of New York, USA, records about 130 precipitation days, with rainfall evenly distributed throughout the year.
Buenos AiresBuenos Aires, Argentina, has around 92 precipitation days annually, mostly during the summer months.
In Brisbane, Australia, the city averages 123 precipitation days per year, making it wetter than Sydney.
Rain Facts From Around the Globe
Let’s explore more fascinating precipitation records:
- Tutunendo, Colombia, gets about 340 days of rain every year, which arguably makes it the wettest place in the world.
- On RĂ©union Island, a tropical cyclone generated 1825 mm in just 24 hours.
- Singapore receives thunder on 167 days in the year and is considered one of the most thunderous cities in the world.
- The smallest drops that fall are called drizzle drops, and they have a diameter of 0.5 mm.
- Some heavy storms generate "diamond dust," which consists of very small ice crystals that float in the air.
For more detailed information about rainfall patterns in Casargo, visit our Rainfall & Precipitation page.
Current rainfall in Casargo


