Cancún Weather and Climate: A Comprehensive Guide
Cancún has an almost perfect climate for sun and beach holidays. Temperatures in Cancún are almost everyday around 30°C during the day and between 20°C and 22°C at night. In the period April to September, almost every day the temperature reaches the tropical thirty degrees limit. During winter months the daytime temperatures average drops slightly below 30°C.
In summer it is considerably wetter than in the winter. The precipitation that falls out usually comes in the form of heavy storms that often disappear just as fast as they came. There is a risk of hurricanes and tropical storms in the period June till November. The risk is the highest in August, September and October. Sometimes such hurricanes causes considerable damage. Fortunately, the chances of this are not as great as it seems, but those who don't want to take any chances should avoid these months.
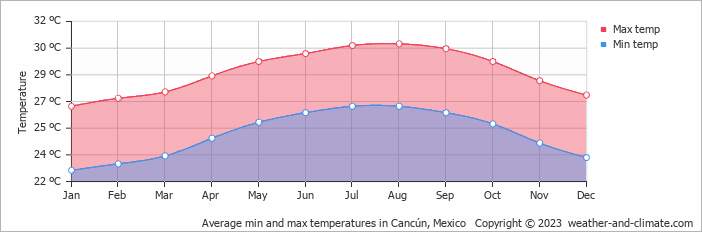
Average maximum day and minimum night temperature
The climate in Cancún remains fairly constant, offering comfortable temperatures throughout the year. Average maximum daytime temperatures range from a very warm 31°C in August, the warmest time of the year, to a comfortable 27°C during cooler months like January.
At night, temperatures typically drop to an average of around 23°C during these months. Check out our detailed temperature page for more information.Temperature ranges by month
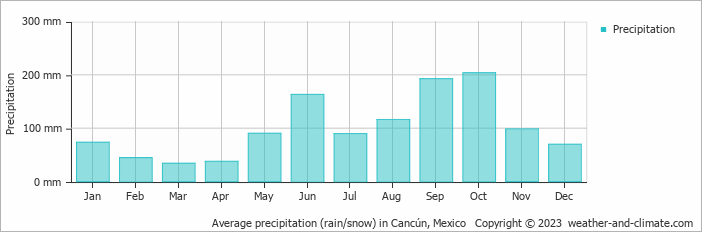
Precipitation and rainy days
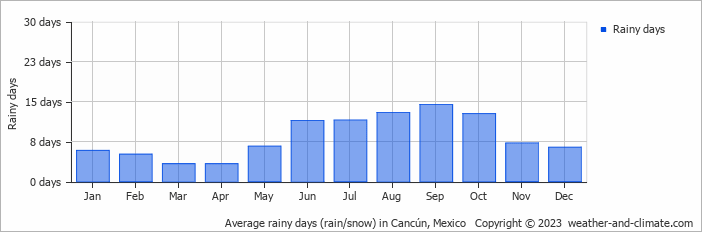
Cancún is known for its substantial rainfall, with annual precipitation reaching 1212 mm. Significant seasonal changes in precipitation occur throughout the year. During the wetter season, October receives heavy rainfall, averaging 204 mm of precipitation, recorded across 13 rainy days. In contrast, the drier season, March brings less rainfall, with 34 mm over 3 rainy days. For more details, please visit our Cancún Precipitation page.The mean monthly precipitation over the year, including rain, hail and snow
The average number of days each month with precipitation
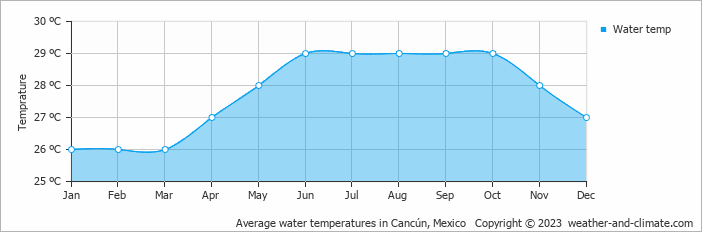
Average water temperature
The mean water temperature over the year ranges from 26°C in January to 29°C in June.
Water temperature over the year
broken clouds and chance of slight rain broken clouds and no rain broken clouds and no rainForecast for Cancún
 3 m/s
3 m/s![]() 2 m/s
2 m/s![]() 3 m/s
3 m/s![]()
The best time of year to visit Cancún in Mexico
The best time to visit is during the drier months: February, March and April.Other facts from our historical weather data:
Most rainfall (rainy season) is seen in June, September and October.
October tops the wettest month list with 204 mm of rainfall.
March is the driest month with 34 mm of precipitation.
No idea where to travel to this year? We have a tool that recommends destinations based on your ideal conditions. Find out where to go with our weather planner.


