Vera Cruz de Itaparica Weather & Climate: Best Time to Visit
Average temperatures, rainfall, sunshine and the best time to visit Vera Cruz de Itaparica.
Climate overview of Vera Cruz de Itaparica
Vera Cruz de Itaparica, Bahia, Brazil, enjoys a steady climate throughout the year, with daytime temperatures typically around 28°C (82°F). March is the warmest month at 30°C (86°F), while August is the coolest at 26°C (79°F).
The city has a wet climate, receiving around 1350 mm (53 in) of rainfall per year. Despite the high annual total, it has a distinct rainy season from April to June. May is the wettest month. The sunniest month is January, with 8.2 hours of sunshine per day on average.
Vera Cruz de Itaparica Weather by Month
Pick a month to see the average temperature, rainfall and sunshine in Vera Cruz de Itaparica — and find the best time to visit.
Monthly Temperature in Vera Cruz de Itaparica
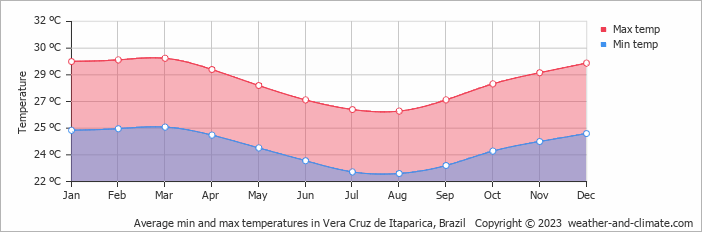
The temperature in Vera Cruz de Itaparica remains steady throughout the year, providing a consistently comfortable climate. On average, daytime temperatures range from a comfortable 30°C (86°F) in March to a comfortable 26°C (79°F) in August.
Nighttime temperatures range from 25°C (77°F) in March to 23°C (73°F) in August.
Check out our detailed temperature page for more information.
Temperature ranges by month
Rainfall in Vera Cruz de Itaparica
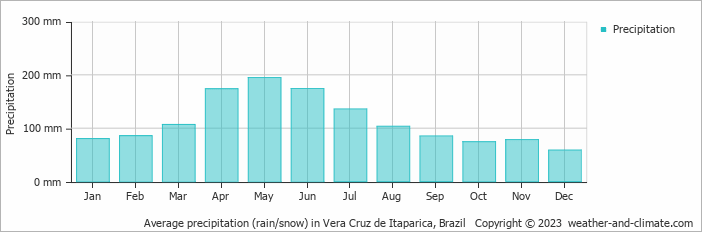
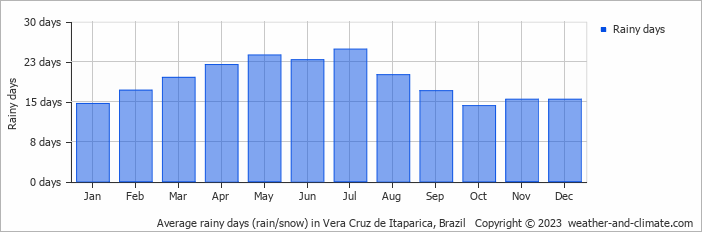
Vera Cruz de Itaparica has a relatively rainy climate with high precipitation levels, averaging 1350 mm (53 in) of rainfall annually. The seasons in Vera Cruz de Itaparica bring significant changes in precipitation. The wettest month, May, receives heavy rainfall, with an average of 195 mm (7.7 in) of precipitation. This rainfall is distributed across 24 rainy days.
In contrast, the driest month, December, experiences much less rainfall, totaling 59 mm (2.3 in) over 15 rainy days. These distinct seasonal differences provide diverse experiences throughout the year. For more details, please visit our Vera Cruz de Itaparica Precipitation page.
The mean monthly precipitation over the year, including rain, hail, and snow
The average number of days each month with precipitation
Sunshine Hours in Vera Cruz de Itaparica
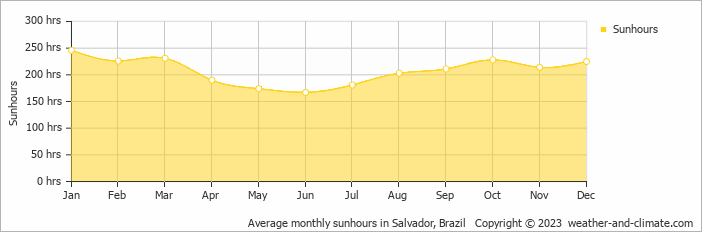
Vera Cruz de Itaparica enjoys sunny spells year-round. January sees up to 8.2 hours of daily sunshine, perfect for a sunny trip. June, the least sunny month, still offers a generous 5.6 hours of sun despite this cloudier time of the year.
Visit our detailed sunshine hours page for more information.
Monthly hours of sunshine
Daily hours of sunshine
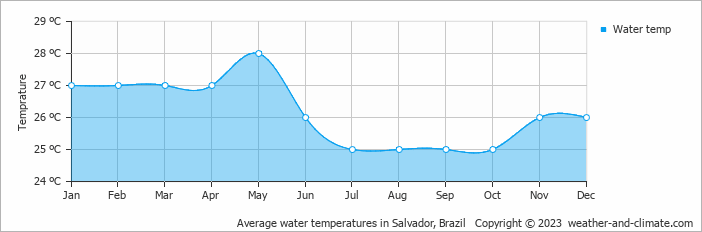
Water Temperature in Vera Cruz de Itaparica
The mean water temperature over the year ranges from 25°C (77°F) in July to 28°C (82°F) in May.
Water temperature over the year
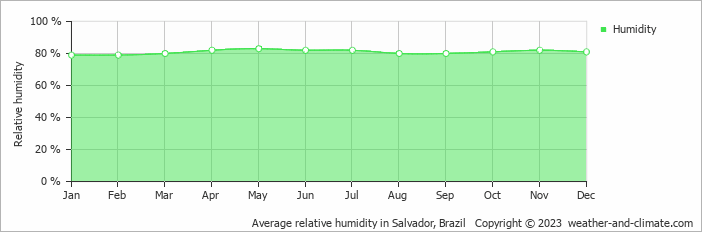
Humidity in Vera Cruz de Itaparica by Month
The city experiences its highest humidity in May, reaching 83%. In January, the humidity drops to its lowest level at 79%. What does this mean? Read our detailed page on humidity levels for further details.
Relative humidity over the year
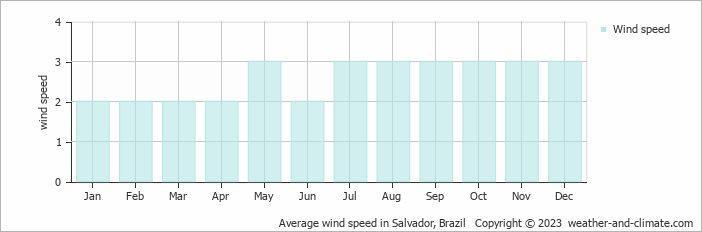
Wind Speed in Vera Cruz de Itaparica
The mean wind speed varies between 2 m/s (4 knots) and 3 m/s (6 knots) throughout the year. It is lowest in January, February, March, April and June and highest during May, July, August, September, October, November and December. What does this mean?
The mean monthly wind speed over the year (meters per second)
Best Time to Visit Vera Cruz de Itaparica
For a more comfortable experience, start your day early when the weather is cooler, or take advantage of the gentle breezes in the late afternoon.
The rainy season occurs during April, May and June, when the area experiences its heaviest rainfall. Need help choosing your next travel destination? We offer a specialized tool that matches you with locations based on your weather preferences. Explore destinations that suit your climate preferences.
Frequently asked questions about the climate in Vera Cruz de Itaparica
What is the best time to visit Vera Cruz de Itaparica?
September, October, November and December typically offer the most optimal weather in Vera Cruz de Itaparica. In contrast, March tends to have less optimal conditions. Vera Cruz de Itaparica has a distinct rainy season from April to June.
What temperatures can I expect in Vera Cruz de Itaparica?
Daytime highs range from 26°C (79°F) in August to 30°C (86°F) in March. Nighttime lows range from 23°C (73°F) to 25°C (77°F). Temperatures stay relatively stable year-round.
How much rain does Vera Cruz de Itaparica get?
Annual rainfall is around 1350 mm (53 in). May is the wettest month with 195 mm (7.7 in), while December is the driest with 59 mm (2.3 in).
How sunny is Vera Cruz de Itaparica?
Vera Cruz de Itaparica receives around 2,496 hours of sunshine per year. January is the sunniest month with 246 hours, while June is the cloudiest with just 167 hours. Overall, Vera Cruz de Itaparica enjoys abundant sunshine.
Vera Cruz de Itaparica 3-Day Forecast
Vera Cruz de Itaparica 3-Day Forecast
Vera Cruz de Itaparica on the map
Vera Cruz de Itaparica is highlighted — select any city to see its climate.
Popular this month
Where to go in July — average daytime high across popular destinations.
Bucket list
Need travel inspiration? Check out our bucket list articles and be inspired.
 The 10 most alternative cities in South America
Discover South America's top 10 alternative cities! From Valparaíso's vibrant streets to La Paz's high-altitude charm and Medellín's innovative spirit.
 The 5 most tranquil retreats in the Amazon Rainforest, Brazil
Discover top sustainable lodges in the Amazon. Enjoy unique wildlife, eco-friendly stays, and immersive experiences at Anavilhanas, Cristalino, and more.
An alternative way to discover Rio de Janeiro
Don't feel like seeing the traditional tourist sights in Rio de Janeiro? We have made an overview of the sights in Rio de Janeiro that you must see if you want to visit Rio in an alternative way.
Iguazu Falls
Iguazu Falls are among the largest waterfalls on earth. You will be speechless when you see this miracle of mother nature. They are included in the World Heritage List and have also been named one of the seven wonders of the world.